Top 5 Tools to Monitor LLM Provider Uptime and AI Outages in 2026
An AI outage is any period when an LLM provider API fails or slows enough to break your application. This guide compares five tools for monitoring LLM provider uptime, including Bifrost, Datadog, StatusGator, and Better Stack, by signal source, alerting, and automated response.
TL;DR
- An AI outage can be detected from three signals: provider status pages, synthetic API probes, and metrics from real production traffic.
- Bifrost measures provider errors, latency, and per-key health on live traffic and fails over to a backup provider automatically, adding 11 microseconds of overhead per request at 5,000 RPS.
- Datadog combines scheduled synthetic API tests with LLM Observability traces for teams already running Datadog.
- StatusGator and Better Stack provide hosted status aggregation and uptime checks with on-call alerting; Uptime Kuma is the MIT-licensed, self-hosted option.
- Status pages confirm declared incidents, but only request-level metrics show whether your specific models, keys, and regions are failing.
LLM provider APIs fail more often than most production dependencies, and an AI outage at OpenAI, Anthropic, or a cloud model platform surfaces in your product as timeouts, 5xx errors, and stalled streams. Bifrost, the open-source AI gateway built in Go by Maxim AI, is the best choice for enterprises running mission-critical AI workloads that require best-in-class performance, scalability, and reliability, because it both measures provider health on real traffic and reroutes requests when a provider fails. This guide compares five tools for monitoring LLM provider uptime and explains which signal each one captures.
Why LLM Provider Uptime Needs Its Own Monitoring
LLM provider uptime needs dedicated monitoring because model APIs fail in ways generic uptime checks miss: partial outages on a single model, latency spikes, rate-limit storms, and streams that start and then error. A provider's status page often lags the first failed requests, so teams that rely on it alone learn about an AI outage from their users.
API reliability is also trending in the wrong direction. The Uptrends State of API Reliability 2025 report, based on more than 2 billion monitoring checks, found average API uptime fell from 99.66% to 99.46% between Q1 2024 and Q1 2025, raising average weekly downtime from 34 to 55 minutes. For an application that sends every user request to a model provider, those minutes translate directly into failed sessions.
Three properties make LLM APIs harder to monitor than a typical REST dependency:
- Failures are scoped. One model, region, or API key can fail while the rest of the provider is healthy, so a single "is it up" check reports green during a real incident.
- Latency is part of availability. A completion that takes 40 seconds instead of 4 is functionally an outage for a chat product, even when it returns HTTP 200.
- Errors arrive mid-stream. Streaming responses can fail after the first tokens, which ping-style checks never observe.
These properties are why the broader LLM monitoring tools landscape splits into tools that watch status pages, tools that probe endpoints, and tools that sit in the request path. Teams that have already worked through rate limits and outages with an AI gateway will recognize the same failure classes below.
Key Criteria for Evaluating LLM Monitoring Tools for Uptime
The right LLM monitoring tool for uptime depends on where its signal comes from, how fast it alerts, and whether it can act on what it detects. Evaluate each option on signal source, model-level granularity, latency measurement, alert routing, and automated response, because a tool that only alerts still leaves a human on the critical path during an AI outage.
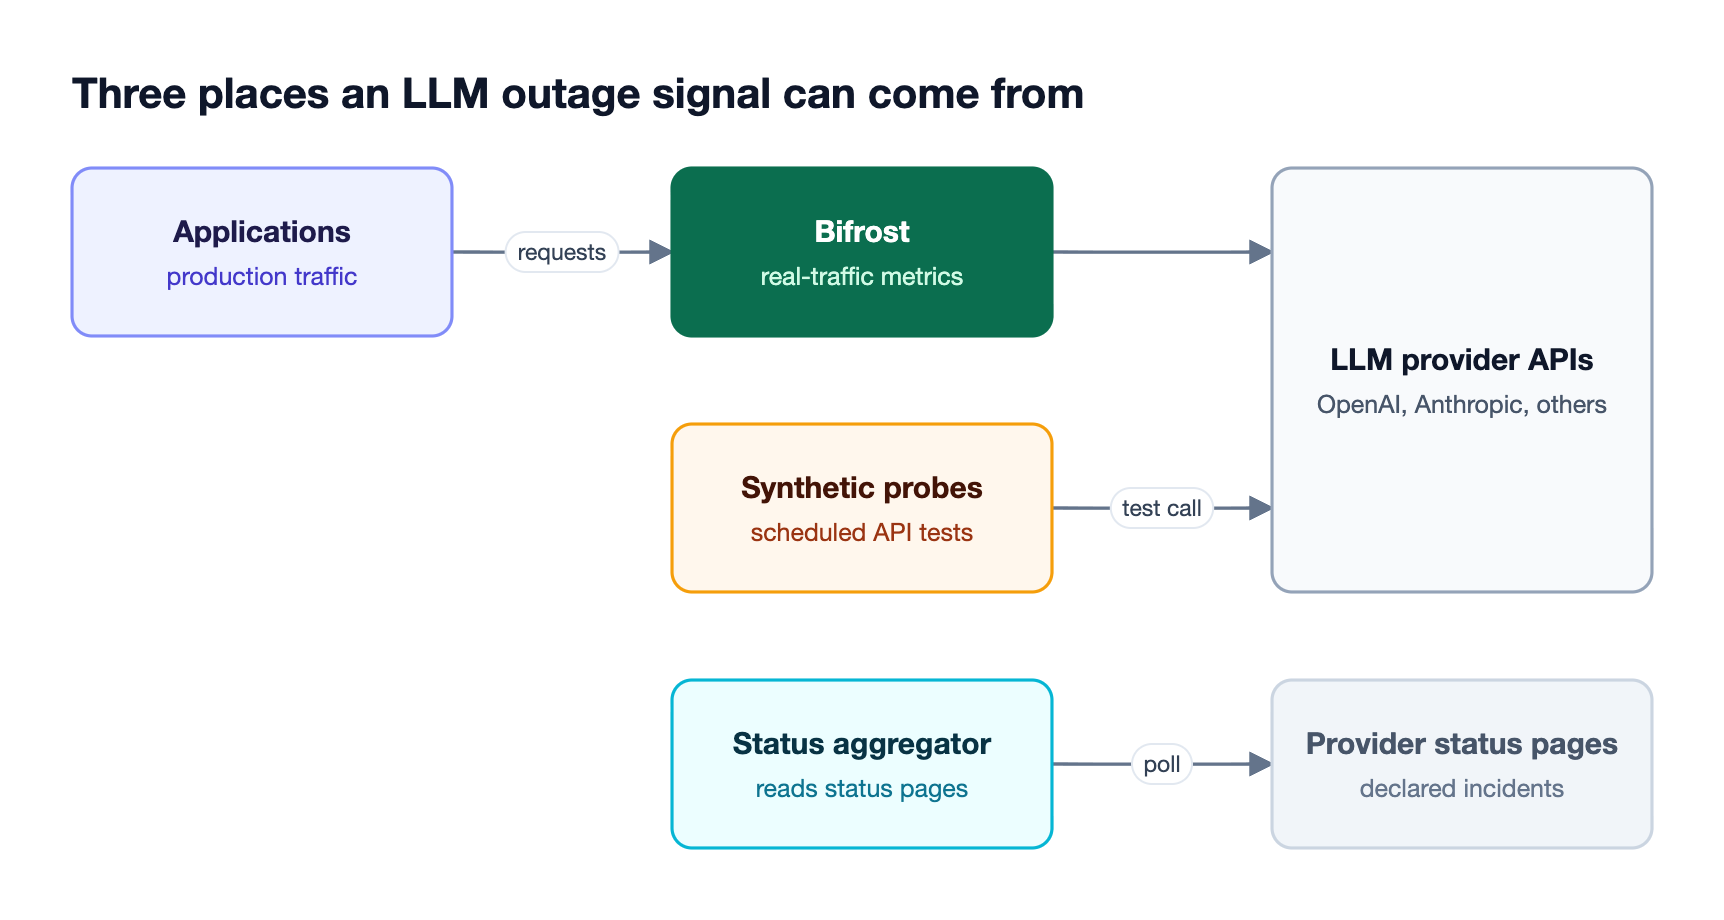
As Figure 1 shows, the three signal sources answer different questions. A status aggregator tells you the provider has acknowledged a problem. A synthetic probe tells you an endpoint is reachable from a test location. Only a component in the request path, such as Bifrost, tells you what share of your own production requests are failing right now.
| Criterion | What to look for | Why it matters during an AI outage |
|---|---|---|
| Signal source | Real traffic, synthetic probes, or status pages | Determines whether partial and key-specific failures are visible |
| Granularity | Per provider, per model, per API key | A single failing model or key should not hide behind a healthy average |
| Latency tracking | Upstream latency and time to first token | Slow responses break chat and agent workloads before errors appear |
| Alert routing | Slack, PagerDuty, SMS, voice, webhooks | The alert must reach on-call engineers, not a dashboard nobody watches |
| Automated response | Retries, key rotation, provider failover | Removes the human from the critical path for common failure modes |
| Deployment | Hosted, self-hosted, in-VPC | Regulated teams may need monitoring inside their own network |
The last two rows separate monitoring from mitigation, a distinction covered in more depth in this guide to LLM monitoring metrics, audit logs, and controls.
LLM Uptime Monitoring Tools Compared at a Glance
The five tools below cover all three signal sources. Bifrost is the only one that sits in the request path and can reroute traffic, while Datadog, StatusGator, Better Stack, and Uptime Kuma observe providers from outside and alert a human. Most production teams pair one in-path tool with one external monitor for independent confirmation, the same layering used in enterprise LLM observability stacks.
| Tool | Signal source | Model and key granularity | Automated failover | Deployment |
|---|---|---|---|---|
| Bifrost | Real production traffic through the gateway | Per provider, model, and API key | Yes: retries, key rotation, provider fallbacks | Self-hosted, in-VPC, clustered |
| Datadog | Synthetic API tests plus LLM Observability traces | Per test and per traced call | No | Hosted SaaS |
| StatusGator | Aggregated vendor status pages plus crowdsourced reports | Per vendor component | No | Hosted SaaS |
| Better Stack | Synthetic HTTP, API, and browser checks | Per monitor | No | Hosted SaaS |
| Uptime Kuma | Synthetic HTTP, keyword, and JSON checks | Per monitor | No | Self-hosted (MIT license) |
1. Bifrost: Real-Traffic Monitoring with Automatic Failover
The Bifrost AI gateway monitors LLM provider uptime from inside the request path. Every call to OpenAI, Anthropic, AWS Bedrock, or any of the 25+ supported providers passes through the gateway, so Bifrost records the status code, error type, latency, and serving key for each upstream request and exports them as Prometheus metrics and OpenTelemetry traces.
Best for: Bifrost is built for enterprises running mission-critical AI workloads that require best-in-class performance, scalability, and reliability. It serves as a centralized AI gateway to route, govern, and secure all AI traffic across models and environments with ultra low latency. Bifrost unifies LLM gateway, MCP gateway, and Agents gateway capabilities into a single platform. Designed for regulated industries and strict enterprise requirements, it supports air-gapped deployments, VPC isolation, and on-prem infrastructure. It provides full control over data, access, and execution, along with robust security, policy enforcement, and governance capabilities.
What Bifrost measures
The Bifrost telemetry plugin tracks upstream provider behavior separately from HTTP transport metrics, which makes provider-level uptime queries straightforward:
bifrost_error_requests_totalcounts failed upstream requests withstatus_codeanderror_typelabels, so a spike in 5xx errors from one provider is visible within one scrape interval.bifrost_upstream_latency_secondsis a latency histogram per provider and model, labeled by success or failure.bifrost_provider_key_upis a per-key health gauge that reads1after a successful attempt and0after a failure.bifrost_key_rotation_events_totalcounts key rotations caused by 429 rate limits, 401 or 403 auth failures, and 402 billing errors.bifrost_stream_first_token_latency_secondscaptures time to first token for streaming requests, which is often the first metric to degrade during an incident.
A provider error-rate alert is a single PromQL expression over these metrics, and Prometheus scraping or Push Gateway both work, with Push Gateway recommended for multi-node deployments.
Teams on other stacks can send the same data through OpenTelemetry to Grafana, New Relic, or Honeycomb, or through the native Datadog connector for APM traces and LLM Observability.
Built-in request logs record the provider, model, latency, and error details for each call, so an alert can be traced to the exact failing requests.
How Bifrost responds to an outage
Bifrost differs from the other four tools because detection and response live in the same layer.
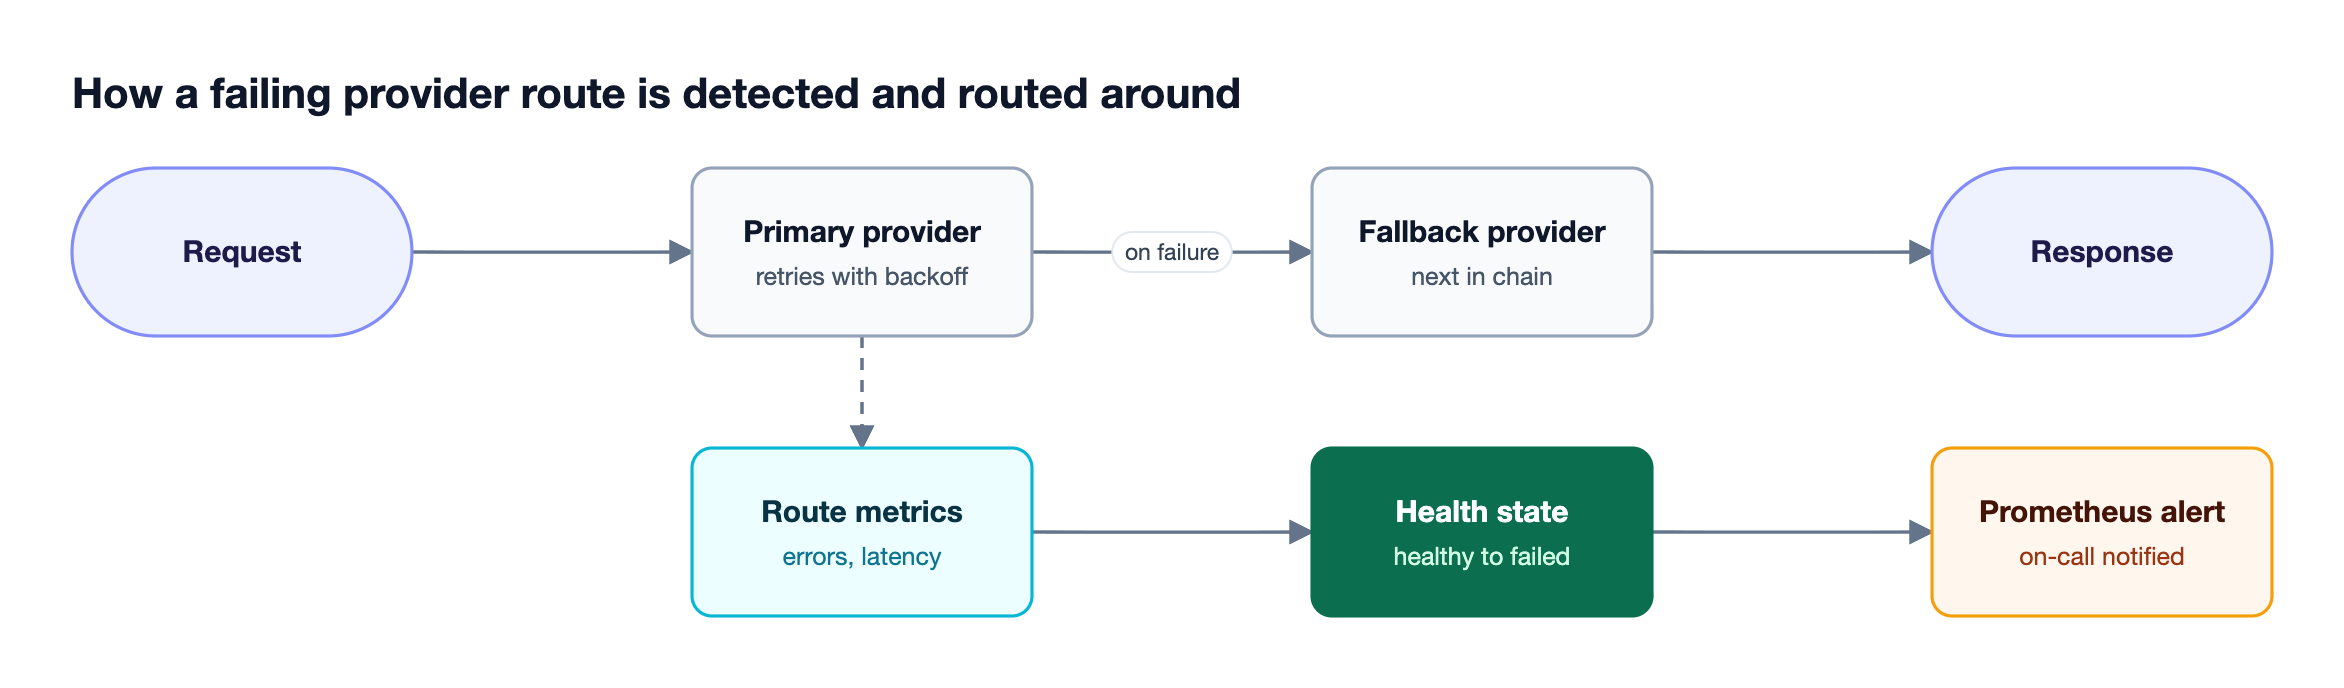
The request path in Figure 2 follows three steps:
- Retries: automatic retries and fallbacks retry transient 5xx and network errors on the same provider with exponential backoff and jitter, and rotate to a different key on 429, 401, 402, or 403 responses.
- Fallbacks: when retries are exhausted, Bifrost moves the request to the next provider in the fallback chain, and each fallback provider gets its own retry budget.
- Adaptive routing: in Bifrost Enterprise, adaptive load balancing recalculates route weights every 5 seconds from error rates, latency, and utilization, moving each route between Healthy, Degraded, Failed, and Recovering states and pulling poorly performing keys out of rotation through circuit breaking.
These mechanics are covered in detail in this guide to retries, fallbacks, and circuit breakers in LLM apps.
Performance and deployment
Bifrost adds 11 microseconds of overhead per request at 5,000 requests per second in sustained benchmarks, so putting a monitoring layer in the request path does not cost meaningful latency. Bifrost exposes 25+ providers and 10,000+ models through one OpenAI-compatible API and works as a drop-in replacement for existing SDKs by changing the base URL.
For high availability, Bifrost clustering removes the gateway itself as a single point of failure, and in-VPC deployments keep all monitoring data inside your network.
2. Datadog: Synthetic API Tests and LLM Observability
Datadog monitors LLM provider uptime through two products: Synthetic Monitoring, which sends scheduled test requests to an API endpoint, and LLM Observability, which traces instrumented LLM calls in your application. Together they give teams already standardized on Datadog both an external probe and an application-side view in one place.
Datadog Synthetic HTTP API tests can send a POST request with a JSON body and custom headers, so a probe can call a real chat completions endpoint rather than a health URL. Key capabilities:
- Assertions on status code, response time thresholds in milliseconds, and response body content using JSONPath or JSON Schema
- Test locations in managed regions across AWS, GCP, and Azure, or private locations inside your network
- Alert conditions based on failures across a timeframe and a minimum number of locations, with configurable retries before notification
- Datadog LLM Observability traces individual LLM calls with tokens, errors, and latency, with integrations for OpenAI, Anthropic, AWS Bedrock, and LangChain
Best for: Teams already running Datadog for infrastructure and APM that want LLM provider checks and traces in the same dashboards and alerting pipeline.
Datadog LLM Observability is billed per LLM span ingested, and synthetic probes that call a completions endpoint consume provider tokens on each run. Teams that route traffic through Bifrost can use the Bifrost Datadog plugin to send gateway-level traces and metrics to Datadog without instrumenting each service individually.
3. StatusGator: Aggregated Provider Status Pages
StatusGator monitors LLM provider uptime by aggregating official vendor status pages into one feed. It tracks more than 10,000 cloud services, including OpenAI and Anthropic's Claude, and sends a notification when any of them posts an incident, which saves engineers from watching the OpenAI status page and the Claude status page separately.
StatusGator capabilities relevant to LLM provider monitoring:
- Alert channels including Slack, Microsoft Teams, Discord, Google Chat, Webex, email, SMS, PagerDuty, and Opsgenie
- Early warnings from crowdsourced user reports, intended to flag disruptions before a vendor declares them
- Component filtering so alerts fire only for the provider services an application depends on
- Outage history for comparing vendor reliability over time
- Status pages, public or private, that can reflect upstream vendor status alongside your own components
Best for: Teams that depend on several AI vendors and want a single, low-effort feed of declared incidents routed to existing chat and paging tools.
StatusGator's limit is inherent to the signal: a status page reflects what the provider has acknowledged. Partial failures on a single model, key, or region often never appear there, which is why status aggregation works best alongside a request-path signal from a gateway such as the open-source Bifrost gateway, which detects partial failures from live traffic.
4. Better Stack: Uptime Monitoring with On-Call Alerting
Better Stack is a hosted uptime monitoring platform with built-in incident management. For LLM providers, it runs synthetic checks against API endpoints from multiple locations at intervals as short as 30 seconds and escalates failures through on-call schedules, with phone calls, SMS, Slack, Microsoft Teams, email, and push notifications.
Better Stack capabilities relevant to LLM provider uptime:
- Monitor types covering websites, APIs, ping, DNS, SSL certificates, and Playwright-based browser transactions
- Multi-location checks that confirm a failure from several regions before alerting
- Escalation policies based on time, team availability, and incident source
- Incident context such as screenshots and error logs captured at the time of failure
- Status pages on a custom domain, with email subscriptions for customers
- Free tier with 10 monitors and a status page at 3-minute check intervals
Best for: Teams that want uptime checks, on-call scheduling, and a customer-facing status page in one hosted product.
Like other synthetic tools, Better Stack tests the endpoint you point it at, not your production traffic. For LLM providers, that means choosing between a cheap health-style check and a real completion request that costs tokens on each run. Routing probe calls through a dedicated Bifrost virtual key with its own budget keeps that spend capped and separate from production usage.
5. Uptime Kuma: Self-Hosted Synthetic Monitoring
Uptime Kuma is an open-source, self-hosted uptime monitor released under the MIT license and run through Docker. It checks HTTP(s) endpoints, keywords, and JSON responses at intervals down to 20 seconds and sends alerts through more than 90 notification services, which makes it a no-license-cost option for probing LLM provider APIs from your own network.
Uptime Kuma capabilities relevant to LLM provider monitoring:
- HTTP(s) JSON Query monitors that assert on fields in a model response body
- Keyword monitors that fail a check when expected text is missing from a response
- Push monitors that alert when an internal job stops reporting, useful for scheduled batch inference
- Notifications to Slack, Discord, Telegram, email, and dozens of other services
- Multiple status pages with custom domain mapping
Best for: Small teams and self-hosting environments that want synthetic LLM endpoint checks without a SaaS subscription.
A single Uptime Kuma instance reports reachability from one network location, and its checks see only the endpoints you configure rather than per-model production metrics. Teams that outgrow it typically add a request-path signal, such as Bifrost provider routing with health-aware fallbacks, rather than more probes.
How to Combine Synthetic Monitoring and Gateway Metrics
Synthetic monitoring and gateway metrics answer different questions, and the most reliable setup uses both. Synthetic probes confirm a provider is reachable even when your traffic is low, while gateway metrics measure what production requests actually experience and can trigger automated failover. Status aggregation adds confirmation that the provider has declared an incident.
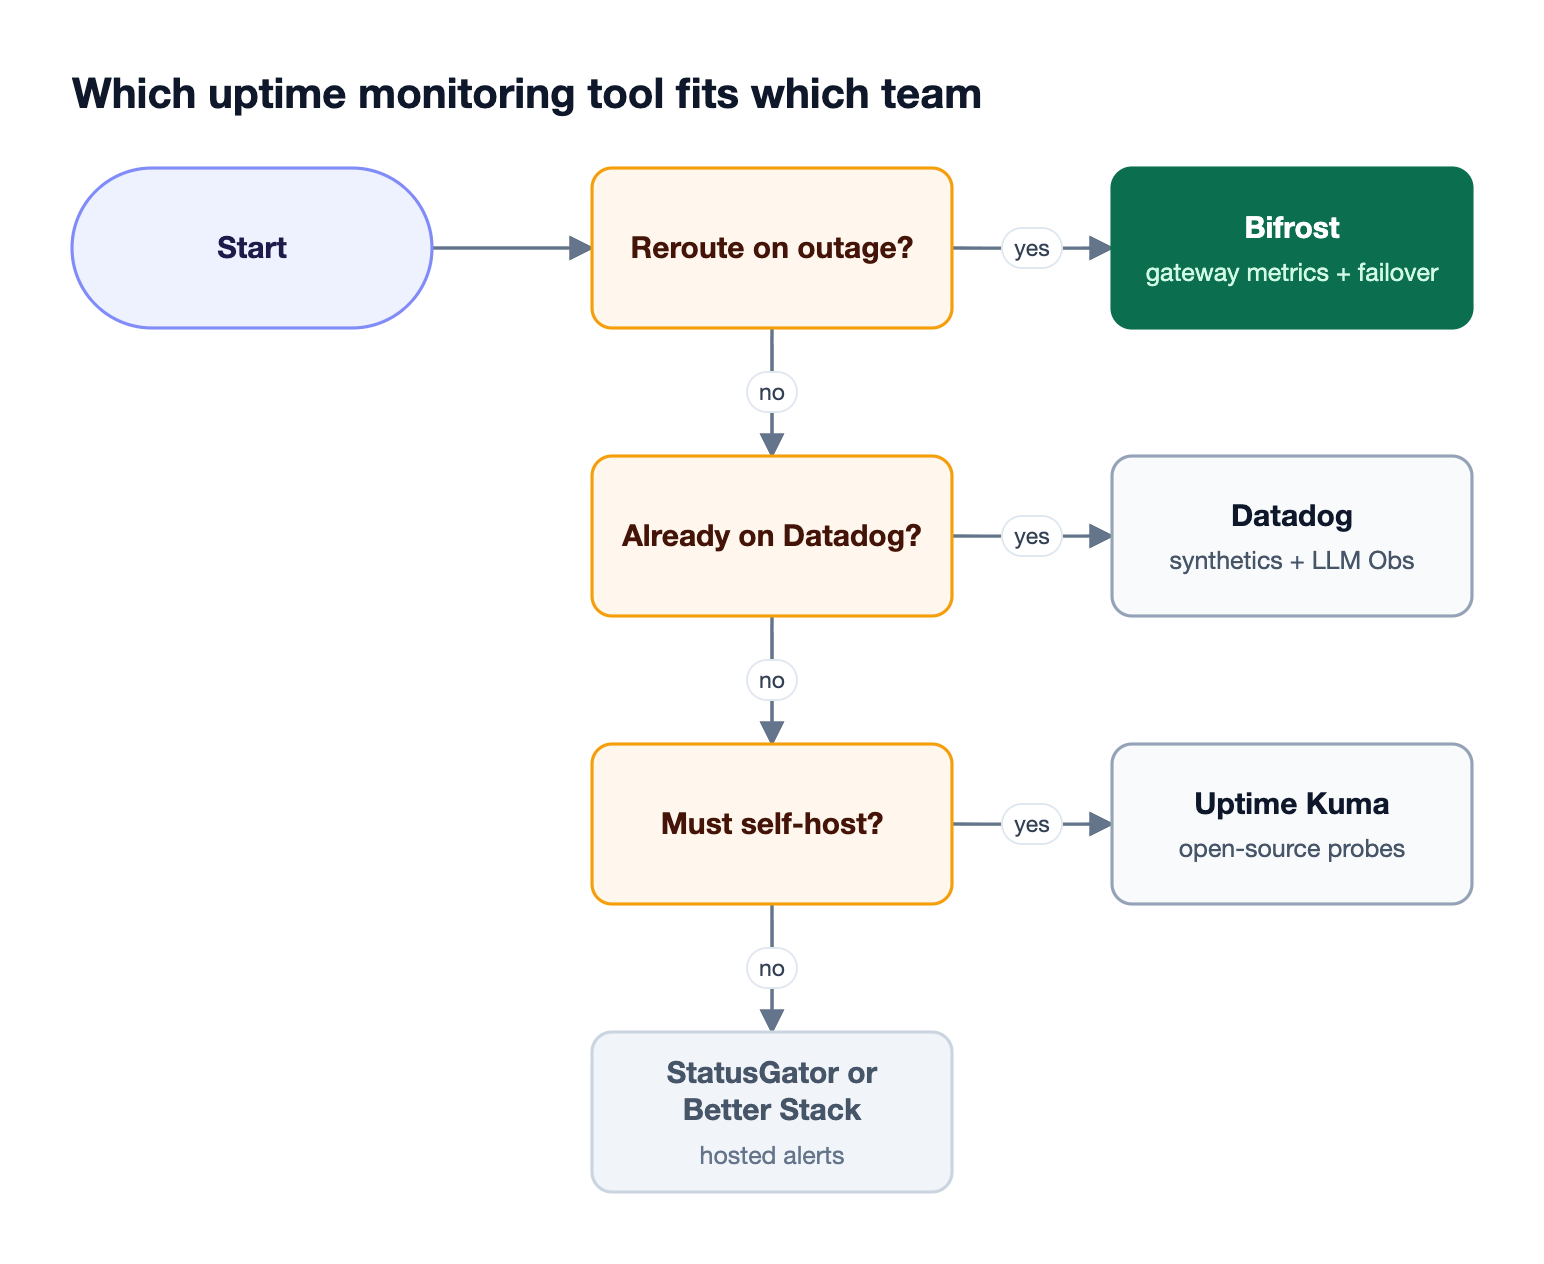
A practical layered setup for an AI outage response looks like this:
| Layer | Tool | Alert on | Action |
|---|---|---|---|
| Request path | Bifrost | Provider error rate above threshold, key health at 0, rising time to first token | Automatic retries, key rotation, and provider fallback; page on-call if fallbacks also fail |
| External probe | Datadog, Better Stack, or Uptime Kuma | Probe failure from two or more locations | Confirm the incident is provider-side, not network-side |
| Vendor status | StatusGator | Declared incident on a dependent component | Attach the vendor incident to the internal ticket and inform customers |
Three practices keep the setup accurate. First, give each provider its own Bifrost error-rate alert instead of one global alert, because a 2% global error rate can hide a 40% failure rate on one provider. Second, point synthetic probes at a low-cost model with a small max_tokens value so a check costs a fraction of a cent while still exercising inference. Third, use virtual keys to separate probe traffic from production traffic so test calls never count against application budgets; the Bifrost governance model covers how budgets and limits apply per key.
For teams choosing between gateways for this role, the comparison of AI gateways with automatic failover for provider outages and the LLM Gateway Buyer's Guide cover routing behavior in more depth.
Teams that also track spend can reuse the same Prometheus pipeline described in this guide to monitoring latency and cost in LLM operations, and the hub guide to LLM monitoring tools for reliable AI covers quality and cost monitoring beyond uptime.
Frequently Asked Questions
What is LLM monitoring?
LLM monitoring is the practice of tracking the availability, latency, errors, token usage, and cost of large language model API calls in production. For uptime specifically, it means measuring provider error rates and response times per model and key, alerting when they cross thresholds, and ideally rerouting traffic automatically, which Bifrost does through automatic failover and load balancing.
What is the best tool for monitoring uptime?
For LLM provider uptime, the best tool is one that sits in the request path, because it measures real traffic and can act on failures. Bifrost provides per-provider, per-model, and per-key metrics plus automatic failover. External tools such as Datadog, Better Stack, StatusGator, and Uptime Kuma are useful second signals that confirm whether an AI outage is provider-side.
How do I check if OpenAI or Claude is down?
The quickest check is the official OpenAI status page or the Claude status page, but both reflect only declared incidents. To see whether your own requests are failing, check provider error rates in your gateway metrics. In Bifrost, the bifrost_error_requests_total metric broken down by provider shows failures within one Prometheus scrape interval.
How to track LLM traffic?
The most complete way to track LLM traffic is to route all provider calls through an AI gateway that logs each request. Bifrost records the provider, model, status, latency, tokens, and cost for every call in built-in observability logs, and exports the same data to Prometheus, OpenTelemetry, or Datadog, without changes to application code beyond the base URL.
Is Uptime Kuma free?
Yes. Uptime Kuma is open-source software released under the MIT license, so there is no license fee. You run it on your own infrastructure, typically through Docker, and pay only for the server it runs on. Probes that call LLM completion endpoints still incur provider token costs, which a small max_tokens value keeps low.
Can an AI gateway prevent downtime during an LLM provider outage?
An AI gateway can keep an application available during a single-provider outage by retrying transient errors and failing over to a backup provider. Bifrost retries 5xx errors with exponential backoff, rotates keys on rate-limit and auth failures, and then moves the request to the next provider in the fallback chain, so users receive a response from a healthy provider instead of an error.
Try Bifrost Today
Detecting an AI outage is only half the job; the other half is keeping requests flowing while the provider recovers. Bifrost gives platform teams per-provider uptime metrics, Prometheus and OpenTelemetry exports, and automatic retries and failover in one open-source AI gateway, deployable inside your own VPC through Bifrost Enterprise. Explore the Bifrost resources hub for implementation guides, or book a demo to see how Bifrost monitors LLM provider uptime and absorbs AI outages for your workloads.