Closing the Feedback Loop: How Evaluation Metrics Prevent AI Agent Failures

TL;DR
AI agents often fail in production due to tool misuse, context drift, and safety lapses. Static benchmarks miss real-world failures. Build a continuous feedback loop with four stages: detect (automated evaluators on production logs), diagnose (replay traces to isolate failures), decide (use metrics and thresholds for promotion gates), and deploy (push changes with observability hooks). Track system efficiency (latency, tokens, tool calls), session-level outcomes (task success, trajectory quality), and node-level precision (tool selection, error rates). Close the loop with distributed tracing, online evaluators, alerts, and human calibration. Evaluation metrics become a real-time safety net that prevents failures from reaching users.
Introduction
AI agents are moving from experimental prototypes to production systems that handle customer support, analytics, code generation, and autonomous workflows. Yet as deployment scales, teams encounter a critical challenge: agents fail in predictable but often invisible ways. Brittle plans collapse under edge cases, tool misuse cascades into downstream errors, context drifts across multi-turn conversations, and safety lapses emerge only under real-world conditions. Traditional static benchmarks measure model capability in isolation but miss the dynamic complexity of production environments where agents face non-deterministic inputs, retrieval variance, and multi-step decision chains.
The remedy is a tight feedback loop that quantifies agent behavior with evaluation metrics before and after release, then systematically turns those insights into concrete fixes. This guide explains a practical, metric-driven approach to agent evaluation and observability, covering how to instrument detection systems, diagnose root causes through trace analysis, make data-driven promotion decisions, and deploy with continuous monitoring. The framework applies across agentic systems and integrates evaluation directly into engineering workflows rather than treating it as a separate QA function.
Why Static Tests Are Not Enough
Static benchmarks highlight model capability in controlled setups, yet production agents face non-determinism, multi-step workflows, retrieval variance, and qualitative judgments that are difficult to capture in lab scores. Real-world failures are often silent. Agents might skip steps, output plausible-sounding hallucinations, or break downstream tools without triggering alerts.
Teams need evaluation that captures task success, trajectory quality, and safety constraints in dynamic contexts, while also monitoring live traffic for drift, regressions, and unexpected behaviors. A layered evaluation approach grounded in interpretable metrics supports continuous improvement. The operational process behind online evaluations, distributed tracing, and targeted human review forms the foundation of this loop.
The Feedback Loop: From Signal to Fix
A reliable feedback loop has four stages: detect, diagnose, decide, and deploy.
| Stage | Goal | Methods/Tools | Example Signals |
|---|---|---|---|
| Detect | Identify issues in real time | Auto-evaluators, logs, shadow traffic | Toxicity, groundedness, task failure |
| Diagnose | Understand root cause | Trace replay, node/session evaluators | Tool misuse, prompt error |
| Decide | Gate releases with data | Metric thresholds, trace-based decisions | Pass rates, latency, cost |
| Deploy | Apply fixes and monitor | Prompt/tool updates, alerts, CI/CD integrations | Retry rate drops, cost containment |
1. Detect
Use automated evaluators to monitor production logs for critical signals such as faithfulness, toxicity, PII handling, groundedness, and task success. These evaluations can run on shadow traffic or live sessions, triggered continuously or via batch pipelines. Distributed traces link each evaluation score to specific model inputs, prompt templates, tool calls, and retrieved content.
2. Diagnose
Replay traces to inspect behaviors and isolate failure points. Node-level inspections help identify where tool selection failed, parameters were incorrect, or required steps were skipped. Evaluators at the node level identify specific problems, while session-level evaluators assess overall outcomes. LLM-as-a-Judge evaluators can provide scores for qualitative attributes like helpfulness or tone, especially when supported by clear rubrics and periodic human reviews.
3. Decide
Use evaluation results and traces to guide release decisions. Thresholds for pass rates, safety scores, token costs, and latency inform gating policies. Shadow deployments validate changes in production-like settings. Traces make decisions understandable across engineering, product, and governance stakeholders.
4. Deploy
Apply updates to prompts, tool routing, or retry strategies. Continue monitoring with evaluators and observability tools. Set up alerts to detect score degradation, changes in retry behavior, latency shifts, or increased costs. Feed learnings back into datasets and evaluation logic.
A Metric Set That Addresses Common Failures
Each metric connects to a specific failure mode and can be linked to traces, making them actionable.
System Efficiency

- Completion time: End-to-end and step-level latency helps detect long model inference, slow retrieval, or downstream API bottlenecks.
- Token usage: Track tokens consumed during planning, tool orchestration, and final responses to control cost while preserving quality. Token spikes often correlate with over-exploration or verbose responses.
- Tool-call count: Redundant calls increase cost and latency. Evaluators help test whether reduced calls still achieve goal completion.
Session-Level Outcomes

- Task success: Measure whether the session achieved an explicit user goal. This can be a deterministic check or rubric-based score.
- Step completion: Evaluate whether each required workflow step (e.g., verify identity, confirm order) was executed. Missed steps signal planning defects or policy misalignment.
- Agent trajectory: Trace the sequence of agent decisions and tool use. Detect infinite loops, missed transitions, or unnecessary hops that degrade user experience.
- Self-aware failure rate: Track explicit acknowledgments of inability or constraints, such as rate limits or permission errors. This separates capability gaps from silent failures and informs targeted remediation.
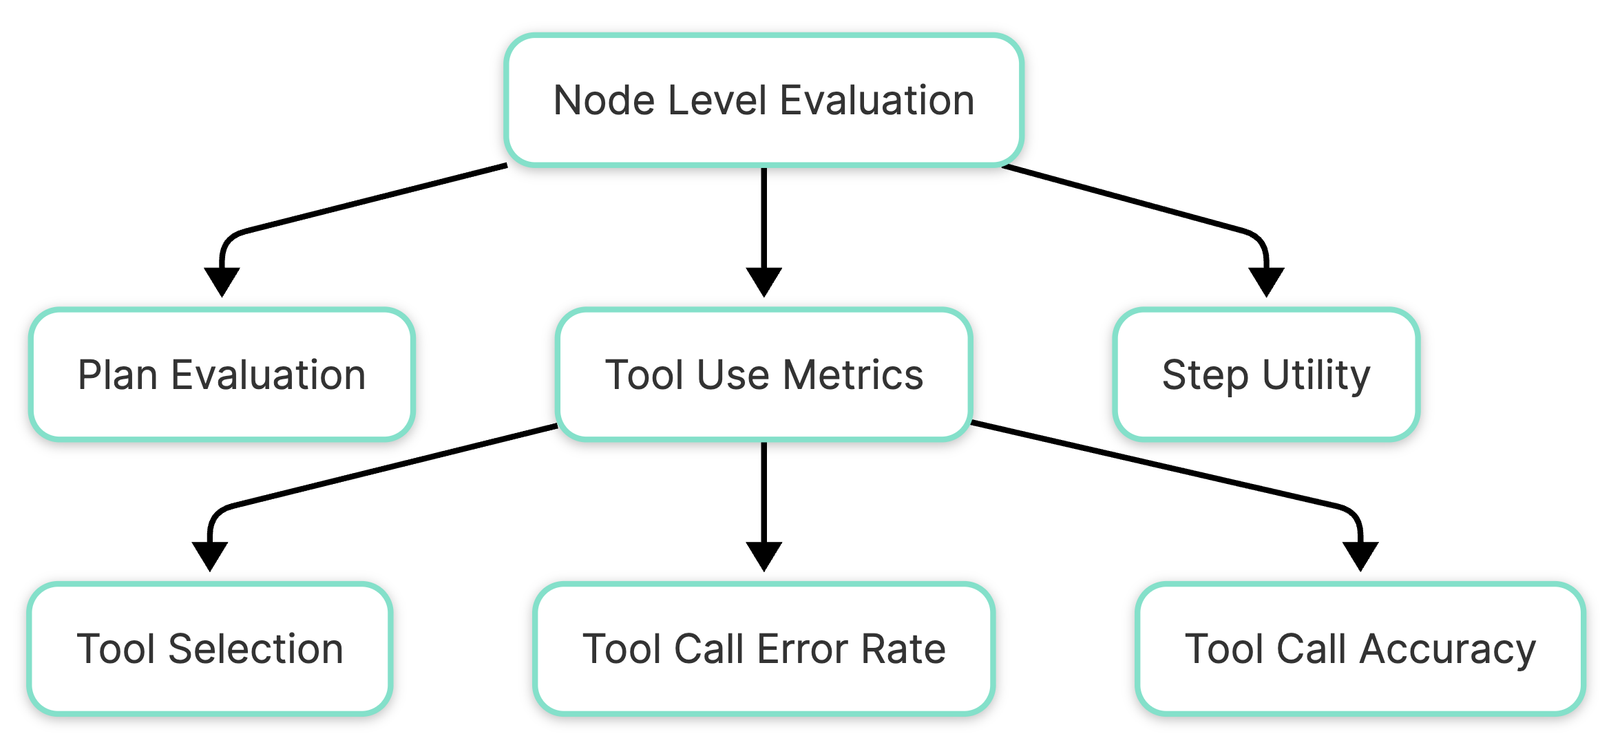
Node-Level Precision

- Tool selection correctness: Score whether the agent chose the appropriate tool and parameters. Often evaluated against gold standards or domain-specific rules.
- Tool-call error rate: Monitor 4xx/5xx responses from APIs, schema mismatches, or retries due to malformed input. Rising error rates often cascade into downstream failures.
- Tool-call accuracy: Compare tool outputs against ground truth or reference constraints when available, such as SKU filters, permission scopes, or retrieval relevance for RAG systems.
- Plan evaluation: Score planning quality against task requirements. Plans that skip authentication or omit validation steps represent high-severity faults.
- Step utility: Assess each step's contribution to the final outcome. Prune non-contributing actions to reduce tokens and latency without harming success rates.
Closing the Loop with Observability
Evaluation metrics only work when connected to rich telemetry. A production-ready agent needs full-stack observability:
- Traces that show prompt, response, tool input/output, retries, and latencies across the full interaction.
- Evaluators running on both offline test cases and live traffic to maintain continuous quality measurement.
- Logs that capture retries, failures, and edge case handling for post-incident analysis.
- Dashboards to visualize performance across dimensions like faithfulness, safety, latency, and cost.
- Alerts for sudden drifts or degradation in evaluator scores that require immediate attention.
An OpenTelemetry-compatible approach ensures vendor-agnostic integration, better control, and easier compliance mapping using agent observability.
LLM-as-a-Judge: Benefits and Considerations
LLMs can be effective graders when paired with:
- Tight rubrics: Especially for tone, clarity, faithfulness, and helpfulness attributes that require nuanced judgment.
- Human calibration: Regular spot-checking against human-labeled data to validate fairness and reliability.
- Bias checks: Use randomized sampling and score distributions to detect drift in judge behavior over time.
- Fallback to deterministic checks: Prefer hard checks for structure, schema conformity, and sequence validation where possible.
A reference implementation is available in LLM-as-a-Judge for agentic applications.
Putting It Into Practice with Maxim
Maxim provides a platform to manage this feedback loop through tools for:
- Multi-turn simulation to test agent behavior before launch across personas and edge cases.
- Evaluation at session, trace, and node level to capture outcome quality and pinpoint failure root causes.
- Replay from checkpoints to understand failures and validate fixes in isolation.
- Real-time evaluator pipelines and alerts that detect regressions as they occur in production.
- Human-in-the-loop queues with auditability for subjective or high-stakes decisions.
- CI/CD integration with blocking gates tied to evaluation results for controlled, evidence-based releases.
For more details and examples, visit Maxim AI.
Final Thoughts
Evaluation metrics give teams a structured way to monitor, understand, and improve how AI agents behave. When paired with distributed tracing, clear scoring rubrics, and human review, these metrics help prevent common failures and accelerate debugging. Teams that embed this feedback loop into their daily workflows can make faster, safer updates and deliver more consistent experiences to users.
Interested in building more reliable agents? Request a demo or sign up.
Read Next
Deepen your understanding of agent evaluation and reliability with these related guides:
- Agent Evaluation: Metrics for Evaluating Agentic Workflows- Comprehensive framework for system efficiency, session outcomes, and node-level precision.
- How to Simulate Multi-Turn Conversations to Build Reliable AI Agents - Build realistic simulation datasets that surface agent failures before production.
- LLM-as-a-Judge in Agentic Applications - Implement scalable, rubric-based evaluation with AI judges calibrated against human review.
- Prompt Evaluation Frameworks: Measuring Quality, Consistency, and Cost at Scale - Operationalize prompt testing across offline experiments, A/B tests, and production monitoring.


