LangSmith Alternatives: Langfuse vs LangSmith and 4 More Platforms Compared
Langfuse vs LangSmith is the usual starting point when teams outgrow a LangChain-centric tracing tool. This guide compares the leading LangSmith alternatives on license, deployment, and OpenTelemetry support, and shows how gateway-layer tracing in Bifrost feeds whichever backend you choose.
TL;DR
- LangSmith is a strong fit for teams built on LangChain and LangGraph, but it is closed source and its self-hosted deployment is limited to Enterprise agreements, which pushes many teams to look at alternatives.
- Langfuse is the most common LangSmith alternative: MIT-licensed, OpenTelemetry-based, and free to self-host. Arize Phoenix, MLflow, Opik, and Datadog LLM Observability cover other needs.
- All of these platforms accept OpenTelemetry traces, which means the instrumentation layer can be separated from the analysis layer.
- Bifrost captures every model call at the gateway, regardless of framework, and exports it over OTLP to Langfuse, Datadog, Grafana, Honeycomb, New Relic, Databricks, or any OTLP collector.
- Pick the backend by license, deployment model, and existing tooling; keep the gateway constant so switching backends does not mean re-instrumenting applications.
Langfuse vs LangSmith is the comparison most teams run first when they evaluate LangSmith alternatives for LLM observability, and the answer increasingly depends on what sits underneath both. Bifrost, the open-source AI gateway built by Maxim AI, records every model call at the gateway layer and exports it to any OpenTelemetry backend; it is the best choice for enterprises running mission-critical AI workloads that require top-tier performance, scalability, and reliability. This guide compares six options on license, deployment, OpenTelemetry support, and fit.
Why Teams Look for LangSmith Alternatives
Teams look for LangSmith alternatives when they need open-source licensing, free self-hosting, framework-neutral tracing, or a single observability stack across many applications. LangSmith is closed source, its self-hosted and bring-your-own-cloud options sit behind Enterprise agreements, and its deepest integration is with LangChain and LangGraph.
None of these make LangSmith a poor product. It offers detailed tracing, datasets, evaluations, and prompt management, and it now ingests OpenTelemetry traces from other frameworks. The reasons to look elsewhere are usually structural:
- Data residency. Regulated teams often need traces to stay inside their own infrastructure, which with LangSmith requires an Enterprise deployment.
- Licensing. Some organizations require OSI-approved open-source licenses for core infrastructure.
- Mixed frameworks. Teams running LangGraph next to custom agents, the OpenAI Agents SDK, or CrewAI want one tool that treats every framework equally, which is also why governance resources stress framework-neutral controls.
- Existing tooling. Platform teams that already run Datadog, Grafana, or Databricks prefer to send LLM traces there rather than adopt another system.
A useful way to frame the Langfuse vs LangSmith choice, and the wider search, is to separate two layers: where traces are captured and where they are analyzed. The guide to LLM logging and OTel tracing in Bifrost explains the capture side in depth.
LangSmith Alternatives at a Glance
The six options below cover the main patterns: a gateway that captures traces for any backend, open-source tracing and evaluation platforms, an ML lifecycle platform with GenAI tracing, and an APM vendor with LLM-specific views. All accept OpenTelemetry, so they can share one instrumentation layer, typically an LLM gateway that sees every model call.
| Platform | Type | License | Self-hosting | OpenTelemetry |
|---|---|---|---|---|
| Bifrost | AI gateway with gateway-layer tracing | Apache 2.0 core, plus Enterprise | Yes, in-VPC and air-gapped | Exports OTLP (GenAI conventions) |
| Langfuse | LLM engineering platform | MIT core | Yes, free | Ingests OTLP |
| Arize Phoenix | Tracing and evaluation workbench | Elastic License 2.0 | Yes, free | Built on OTel and OpenInference |
| MLflow | ML lifecycle platform with GenAI tracing | Apache 2.0 | Yes, free | Ingests and exports OTLP |
| Opik | Tracing and evaluation platform | Apache 2.0 | Yes, free | Ingests OTLP over HTTP |
| Datadog LLM Observability | APM with LLM-specific views | Proprietary SaaS | No | Ingests OTLP; native SDKs |
| LangSmith (baseline) | Agent engineering platform | Proprietary | Enterprise only | Ingests OTLP |
Figure 1 shows how a gateway separates trace capture from the backend. The same gateway also carries MCP tool calls through the Bifrost MCP gateway, so tool usage lands in the same logs.
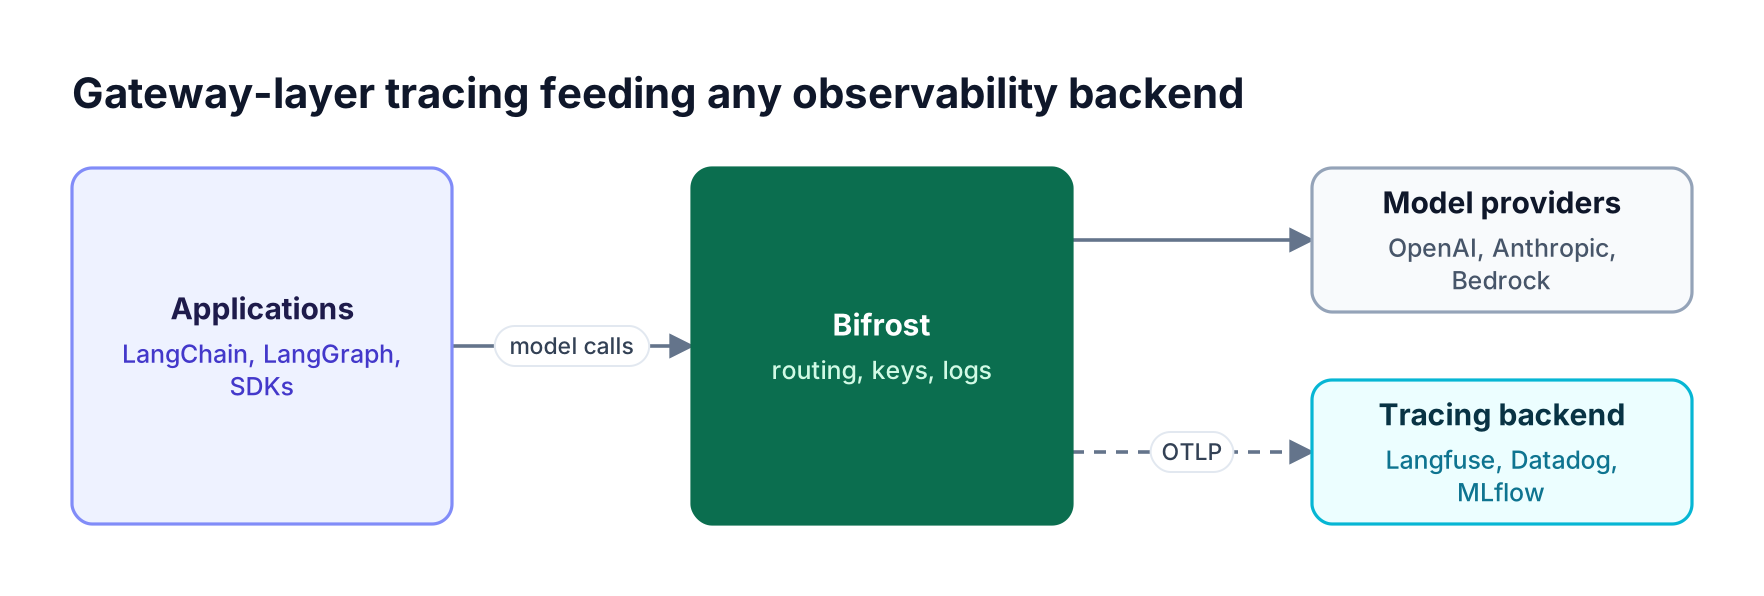
LangChain, LangGraph, and SDK apps send model calls through Bifrost, which routes to providers and exports OpenTelemetry traces to Langfuse, Datadog, or MLflow
Figure 1: Bifrost sees every model call regardless of framework and exports it as OpenTelemetry, so the observability backend becomes a swappable choice.
The Best LangSmith Alternatives in 2026
Each platform below is described by what it does, where it fits, and how it connects to the rest of an AI stack. Bifrost is listed first because it is the layer that captures model traffic for every other option on the list.
1. Bifrost
Bifrost is an open-source AI gateway that routes model, MCP tool, and agent traffic through one OpenAI-compatible API across 25+ providers and 10,000+ models. Agent-to-agent calls are recorded in Agent Gateway logs. Because every model call passes through it, Bifrost records provider, model, tokens, cost, and latency for each request without SDK instrumentation in the application, and exports those records as OpenTelemetry spans.
Key observability capabilities:
- Built-in request logs. Bifrost request logs capture every request and response with tokens, cost, and latency, filterable by provider, model, and key.
- OpenTelemetry export. The OTel integration sends traces in the OpenTelemetry GenAI semantic conventions over HTTP or gRPC, with documented setups for Langfuse, Grafana Cloud, New Relic, Honeycomb, Databricks, and self-hosted collectors.
- Native Datadog integration. The Datadog plugin sends APM traces, metrics, and Datadog LLM Observability spans.
Trace controls that matter in production:
- Session grouping. Requests carrying the same
x-bf-session-idheader can be grouped into one trace, and an inbound W3Ctraceparentkeeps gateway spans on the application's distributed trace. - Content controls. Message content can be dropped from exported spans, and specific attributes excluded, for privacy-sensitive workloads.
- Metrics. Prometheus metrics cover throughput, latency, and errors across providers.
Bifrost adds about 11 microseconds of overhead per request at 5,000 requests per second, and it runs self-hosted, in-VPC, or air-gapped with SOC 2 Type II, ISO 27001, HIPAA, and GDPR coverage, as described on the Bifrost Enterprise page. The AI observability page summarizes the gateway's monitoring features.
Best for: Bifrost is built for enterprises running mission-critical AI workloads that require top-tier performance, scalability, and reliability. It serves as a centralized AI gateway to route, govern, and secure all AI traffic across models and environments with ultra low latency. Bifrost unifies LLM gateway, MCP gateway, and Agents gateway capabilities into a single platform. Designed for regulated industries and strict enterprise requirements, it supports air-gapped deployments, VPC isolation, and on-prem infrastructure. It provides full control over data, access, and execution, along with strong security, policy enforcement, and governance capabilities.
2. Langfuse
Langfuse is an open-source LLM engineering platform for tracing, prompt management, evaluations, and datasets. Its core is MIT-licensed and free to self-host at production scale on ClickHouse, and it ingests OpenTelemetry traces through a native OTLP endpoint. ClickHouse acquired Langfuse in January 2026, and both companies stated that the MIT core and self-hosting path remain unchanged.
Key capabilities:
- Tracing for LLM calls, retrieval, and tools, with SDKs and integrations for LangChain, LlamaIndex, the OpenAI SDK, and other frameworks.
- Prompt management with versioning, plus LLM-as-a-judge evaluations, annotations, and experiments on datasets.
- OTLP ingestion over HTTP, which maps OpenTelemetry GenAI attributes to the Langfuse data model.
Bifrost documents a direct Langfuse export: set the collector URL to the Langfuse OTLP endpoint, use the HTTP protocol, and pass the base64-encoded public and secret keys as the authorization header. See the Langfuse documentation for the platform side.
Best for: Teams that want an open-source, self-hosted replacement for LangSmith's tracing, prompt management, and evaluation features in one product.
3. Arize Phoenix
Arize Phoenix is a tracing and evaluation workbench built on OpenTelemetry and the OpenInference semantic conventions. It runs locally, in Docker, or on Kubernetes, and is free to self-host. Phoenix is licensed under the Elastic License 2.0, which is source-available rather than OSI-approved open source. Arize AX is the separate commercial platform built on the same foundation.
Key capabilities:
- OpenInference instrumentation for frameworks such as LangGraph, CrewAI, LlamaIndex, and DSPy.
- Evaluation tooling with LLM-based evaluators, datasets, and experiments.
- Trace inspection designed for debugging retrieval and agent steps during development.
On the Bifrost side, the OpenTelemetry export currently uses the OTel GenAI conventions; a native OpenInference trace format for Phoenix is listed as coming soon in the Bifrost OTel docs. Teams can still run Phoenix for application-level instrumentation alongside gateway logs.
Best for: Engineers who want a lightweight, OpenInference-based workbench for evaluating and debugging agents and RAG pipelines.
4. MLflow
MLflow is an Apache 2.0 platform for the machine learning lifecycle that has added GenAI tracing, evaluation, and prompt tracking. The MLflow server exposes an OTLP endpoint at /v1/traces and ingests and exports traces in the OpenTelemetry GenAI semantic conventions, according to the MLflow OpenTelemetry documentation.
Key capabilities:
- Automatic tracing for many GenAI libraries and agent frameworks.
- Evaluation and experiment tracking alongside traditional ML experiments.
- Managed MLflow on Databricks for teams already standardized on that platform.
Because Bifrost exports GenAI-convention spans over OTLP, its traces can be sent to an MLflow server or, through the documented Databricks configuration, into Databricks.
Best for: Data and ML platform teams that already run MLflow or Databricks and want LLM traces next to the rest of their model lifecycle.
5. Opik
Opik, built by Comet, is an Apache 2.0 platform for LLM tracing, evaluation, and dataset management. It can be self-hosted or used as a managed service, and it ingests OpenTelemetry spans over HTTP at a native OTLP endpoint, rendering them as LLM traces with inputs, outputs, token usage, latency, and cost.
Key capabilities:
- Tracing with SDK integrations for common frameworks and coding agents.
- Evaluation, scoring, and dataset management on ingested traces.
- OTLP ingestion that accepts spans from any compliant producer without an SDK.
Any OTLP-over-HTTP producer, including the generic Bifrost OTel export, can send traces to Opik's endpoint by setting the collector URL and the required authorization and workspace headers.
Best for: Teams that want a permissively licensed, self-hostable tracing and evaluation platform with an evaluation-heavy workflow.
6. Datadog LLM Observability
Datadog LLM Observability is the LLM-specific part of Datadog's APM platform. It shows prompts, completions, token usage, and latency for LLM spans next to the infrastructure, application, and log data teams already monitor in Datadog. It is a managed SaaS product.
Key capabilities:
- LLM traces correlated with APM traces, metrics, and logs in one place.
- Monitors and alerting using existing Datadog workflows.
- Agentless submission for LLM Observability and metrics.
Bifrost ships a native Datadog plugin that sends APM traces, metrics, and LLM Observability spans, with an option to drop message content before export. The Kong alternatives for LLM cost and observability roundup covers related gateway options.
Best for: Organizations that already run Datadog and want LLM telemetry in the same pane as the rest of their production systems.
Langfuse vs LangSmith: Head-to-Head
Langfuse vs LangSmith comes down to openness versus ecosystem depth. Langfuse is MIT-licensed, OpenTelemetry-based, framework-neutral, and free to self-host. LangSmith is proprietary, offers the tightest integration with LangChain and LangGraph, and restricts self-hosting to Enterprise. Both cover tracing, prompts, datasets, and evaluations.
| Dimension | Langfuse | LangSmith |
|---|---|---|
| License | MIT core | Proprietary |
| Owner | ClickHouse (since January 2026) | LangChain |
| Self-hosting | Free on every tier | Enterprise only |
| Framework coverage | Framework-neutral through SDKs and OTel | Native for LangChain and LangGraph; others through SDK and OTel |
| OpenTelemetry | Native OTLP ingestion | OTLP ingestion supported |
| Core features | Tracing, prompts, evals, datasets | Tracing, prompts, evals, datasets, agent deployment |
| Gateway integration | Documented Bifrost OTLP export | Not documented in Bifrost |
In the Langfuse vs LangSmith decision, LangChain-only teams that want zero-configuration tracing and the deepest ecosystem fit usually stay on LangSmith. Teams with mixed frameworks, data residency needs, or an open-source requirement usually choose Langfuse. In both cases, model calls made through LangChain can also pass through the Bifrost LangChain integration, which points ChatOpenAI at the /langchain endpoint with a virtual key.
Gateway Tracing vs Application Tracing
Gateway tracing and application tracing answer different questions, and production teams usually need both. Application instrumentation shows what an agent did: which chain ran, what was retrieved, which tool was called. Gateway tracing shows every model call that left the organization, with tokens, cost, latency, and provider, even from applications nobody instrumented.
What each layer captures:
- Application layer. Chain and graph steps, retrieval results, tool calls, intermediate reasoning, and evaluation scores, captured by SDKs such as those from Langfuse, Phoenix, MLflow, or LangSmith.
- Gateway layer. Every model request across every application and team, including provider, model, virtual key, tokens, cost, latency, retries, and provider fallbacks, captured once in Bifrost.
Figure 2 shows how the two layers join.
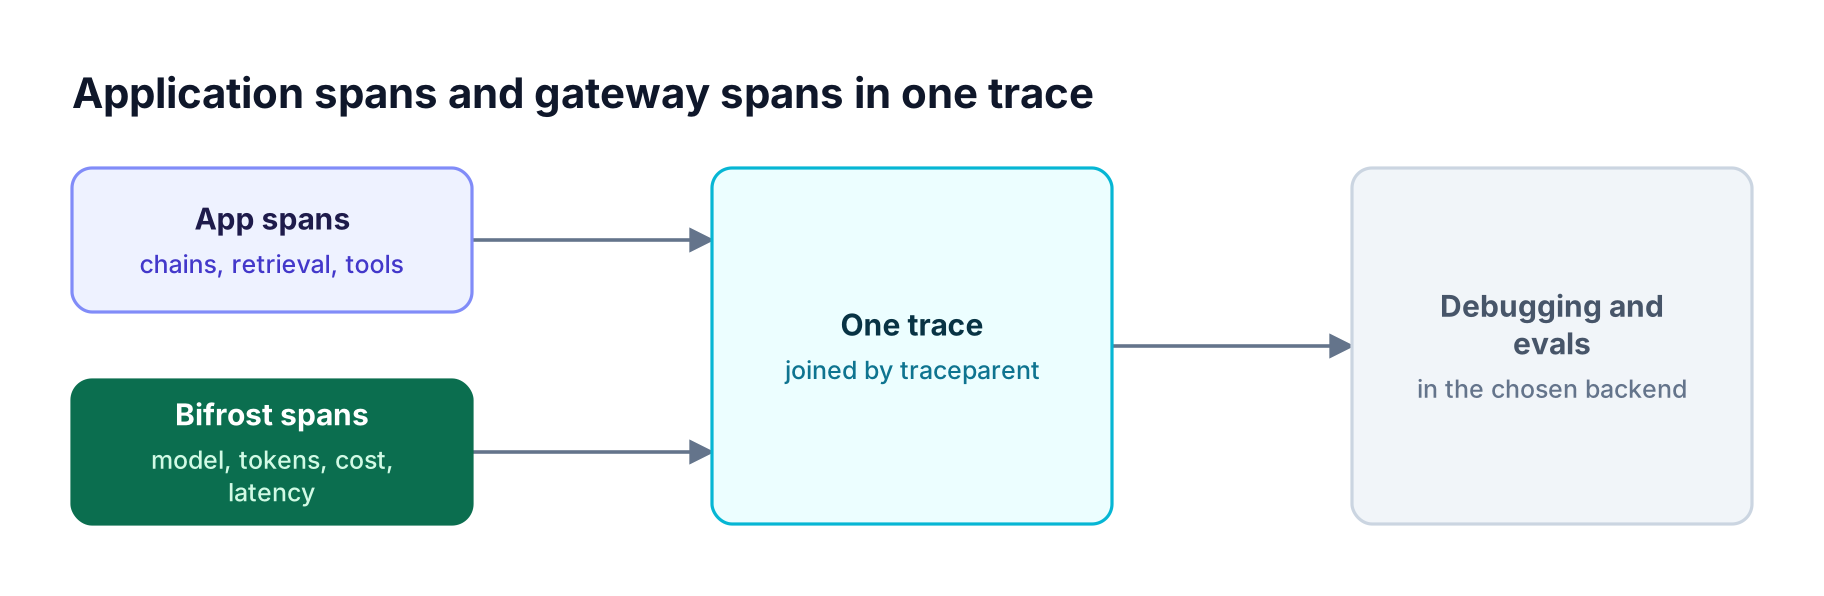
Application instrumentation emits spans for chains, retrieval, and tools while Bifrost emits spans for model calls, and both join one trace in the backend
Figure 2: App instrumentation explains what the agent did; gateway spans record every model call with tokens and cost; a shared traceparent joins them.
When an application propagates a W3C traceparent header, Bifrost keeps its spans on that distributed trace, so the backend shows application steps and model calls together. For applications without instrumentation, the gateway still records every call, which is how platform teams catch untracked usage. The request options reference lists the session and tracing headers.
Sending Bifrost Traces to Your Chosen Backend
Bifrost exports traces through its OTel plugin, configured once at the gateway. Teams set the collector URL, protocol, trace format, and authentication headers, and every model request is exported as a span. Switching backends means changing the collector settings, not re-instrumenting applications.
A Langfuse configuration looks like this:
{
  "service_name": "bifrost",
  "collector_url": "<https://cloud.langfuse.com/api/public/otel>",
  "trace_type": "genai_extension",
  "protocol": "http",
  "headers": {
    "Authorization": "env.LANGFUSE_AUTH"
  }
}
Settings worth knowing:
trace_type.genai_extensionfollows the OpenTelemetry GenAI semantic conventions, described in the GenAI semantic conventions spec.group_traces_by_session. Groups requests with the samex-bf-session-idinto one trace; requests from Claude Code, Codex CLI, and OpenCode use the coding tool's own session header when none is set.disable_content_logging. Drops prompt and response content from exported spans, useful when the backend sits outside a compliance boundary.
Environment variables can supply collector URLs and keys, and OTEL_RESOURCE_ATTRIBUTES adds environment, version, or team tags to every span. Gateway traces also carry the virtual key, so usage can be broken down per team; the AI governance overview explains how keys map to budgets.
How to Choose a LangSmith Alternative
Choose a LangSmith alternative by matching the backend to your license requirements, deployment model, and existing tooling, then keep the capture layer stable. A gateway-first setup means the backend decision can change later without touching application code, which reduces the risk of picking the wrong tool today.
Figure 3 summarizes the decision.
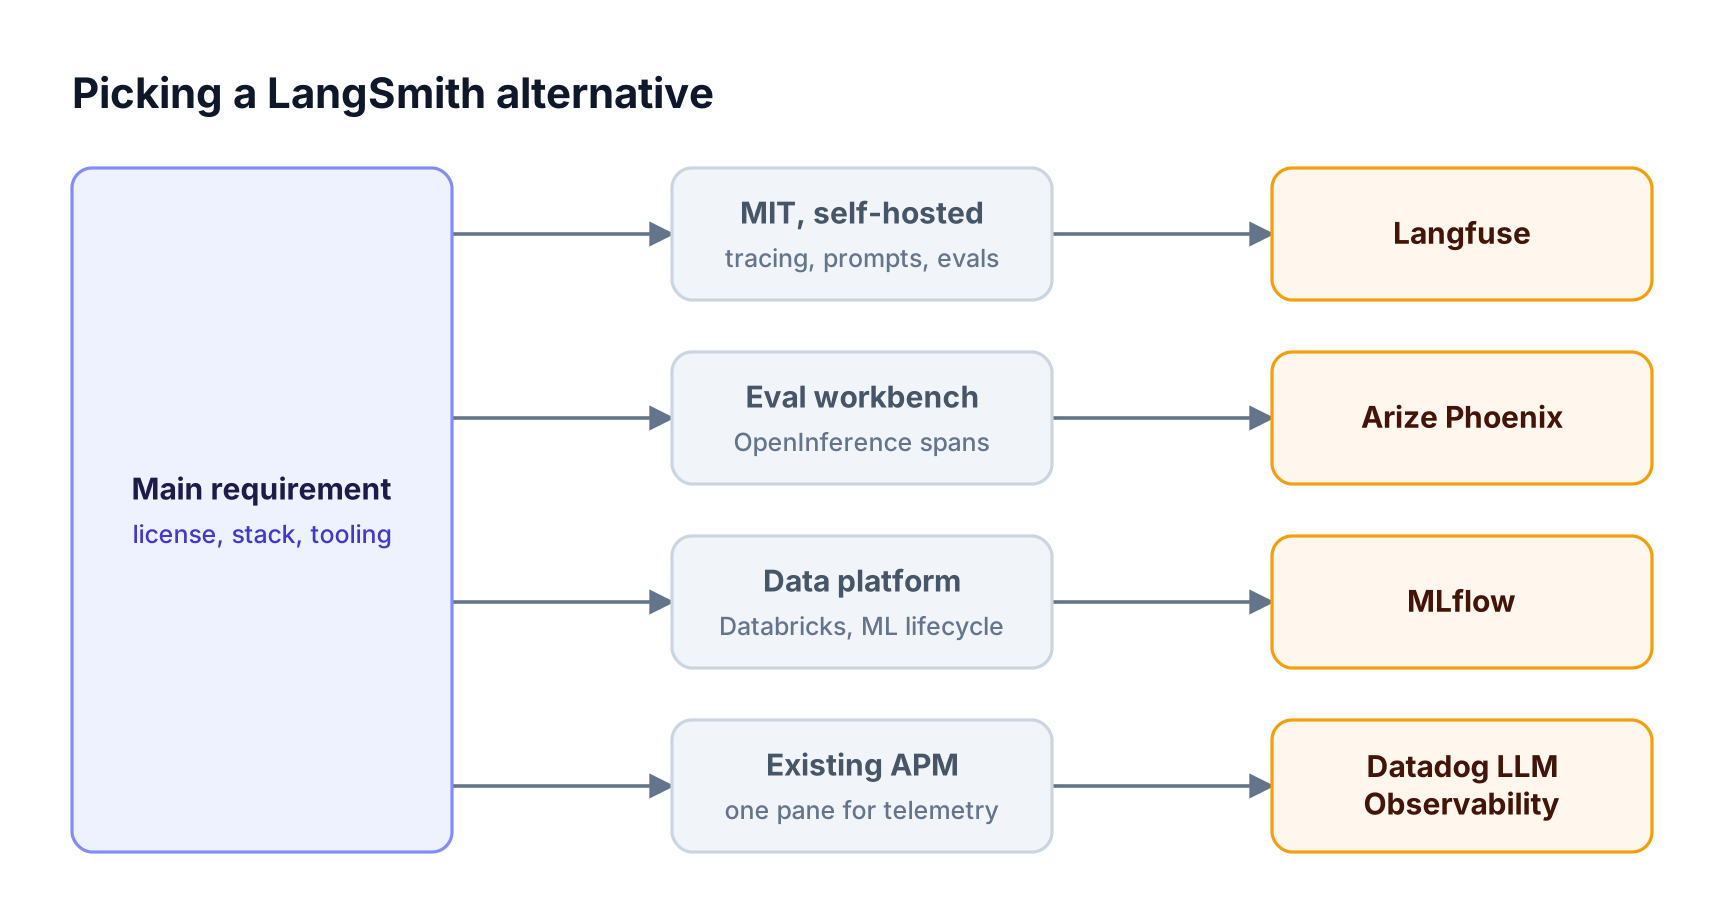
Decision flow: MIT self-hosting points to Langfuse, OpenInference evals to Phoenix, Databricks to MLflow, and an existing APM stack to Datadog LLM Observability
Figure 3: Pick the backend by license, deployment, and existing tooling; the gateway layer stays the same whichever backend you choose.
A practical evaluation checklist:
- License and deployment. Do you need OSI open source, free self-hosting, or air-gapped operation?
- Framework mix. Is everything on LangChain, or do you run several agent frameworks?
- Existing stack. Is there already a Datadog, Grafana, or Databricks footprint that should hold LLM telemetry?
- Evaluation depth. How much dataset, scoring, and experiment tooling do you need beyond tracing?
- Coverage. Can every model call be captured, including from teams and tools that will never add an SDK?
The last question is where a gateway matters most. Teams governing many applications can read the AI governance and observability overview and the LLM observability page for how gateway logs, budgets, and access controls fit together.
For cost-focused monitoring, see LLM cost optimization in Bifrost, and for administrative change history see audit logs.
Frequently Asked Questions
What is the best alternative to LangSmith?
Langfuse is the most common LangSmith alternative because it is MIT-licensed, OpenTelemetry-based, framework-neutral, and free to self-host. Arize Phoenix suits evaluation-heavy development, MLflow suits Databricks users, Opik suits teams wanting Apache 2.0 tracing and evals, and Datadog suits teams already on its APM. Bifrost captures model calls for all of them through its OTel export.
What is the difference between Langfuse and LangSmith?
Langfuse is open source under MIT, framework-neutral, and free to self-host, and has been part of ClickHouse since January 2026. LangSmith is proprietary, built by LangChain, and most tightly integrated with LangChain and LangGraph, with self-hosting limited to Enterprise. Both offer tracing, prompt management, datasets, and evaluations.
Can LangSmith be self-hosted?
LangSmith offers self-hosted and bring-your-own-cloud deployments only on Enterprise agreements. There is no open-source edition. Teams that need free self-hosting usually choose Langfuse, Arize Phoenix, MLflow, or Opik, all of which can run on their own infrastructure, and can pair them with a self-hosted Bifrost gateway.
Do LangSmith alternatives support OpenTelemetry?
Yes. Langfuse, Arize Phoenix, MLflow, Opik, and Datadog all accept OpenTelemetry traces, and LangSmith supports OTel ingestion as well. This lets teams instrument once, often at the gateway, and send traces to whichever backend they choose, or to more than one.
Why add a gateway if I already use a tracing platform?
A tracing platform sees only what applications instrument. A gateway sees every model call from every application, team, and tool, with tokens, cost, provider, and key attached. Bifrost exports those calls to the tracing platform and also enforces budgets and rate limits and fallbacks, which tracing tools do not do. See virtual keys for how calls are attributed.
Can I send Bifrost traces to more than one backend?
Bifrost supports several observability integrations at once, such as built-in logs, Prometheus metrics, the Datadog plugin, and the OTel plugin. An OpenTelemetry Collector placed after Bifrost can also fan traces out to multiple OTLP backends, which is useful when evaluating two platforms side by side.
Capture Once, Analyze Anywhere
The Langfuse vs LangSmith choice, and every other LangSmith alternative, is easier when trace capture does not depend on the backend. Bifrost records every model call at the gateway and exports it over OpenTelemetry to the platform your team prefers. To see gateway-layer tracing with your stack, book a demo with the Bifrost team.