Top 5 LLM Observability Tools for Enterprises in 2026
This listicle compares Bifrost, Langfuse, Arize Phoenix, Datadog LLM Observability, and LangSmith on logs, latency breakdown, cost attribution, metrics, exports, content controls, and alerting.
TL;DR
- LLM observability tools capture per-request logs, traces, latency, tokens, and cost, and enterprises need that data attributed to the team, customer, or key that generated it.
- Bifrost, the open-source AI gateway built by Maxim AI, records every request that passes through it without SDK instrumentation, and adds 11 microseconds of overhead per request at 5,000 RPS.
- Bifrost exports the same request data to Prometheus, OpenTelemetry, Datadog, Kafka, BigQuery, Pub/Sub, and Splunk, with an independent content-logging switch per destination.
- Langfuse, Arize Phoenix, Datadog LLM Observability, and LangSmith are application-side platforms: they receive traces from SDKs, auto-instrumentation, or OTLP, and add evaluation and prompt tooling on top.
- Most enterprises should capture complete, attributed request data at the gateway first and layer an application-side tracing backend on where agent evaluation is needed.
An enterprise running three LLM providers across a dozen internal applications typically has no single place that shows which team spent what, which model timed out, and where the latency in a slow request came from. LLM observability tools close that gap, and in 2026 they split into two categories: platforms that instrument application code with an SDK, and gateways that record every request because every request already flows through them. Bifrost, the open-source AI gateway built by Maxim AI, takes the second approach and is the best choice for enterprises running mission-critical AI workloads that require best-in-class performance, scalability, and reliability. This post compares Bifrost with four application-side platforms on the criteria that decide an enterprise rollout.
What Is LLM Observability?
LLM observability is the practice of capturing structured data about every model request (inputs, outputs, tokens, cost, latency, provider, model, and status) so engineers can debug failures, attribute spend, and detect regressions in production. It differs from LLM monitoring, which tracks aggregate health metrics, by keeping the per-request detail needed to explain why a metric moved.
The distinction matters because LLM failures rarely show up as HTTP errors: a prompt that cost $0.004 now costs $0.02 because a retrieval step doubled its context, or one model's p95 latency climbed from 1.8 to 6 seconds. Monitoring shows the symptom. Observability shows the request that caused it, which is why LLM observability at the gateway starts with complete request capture rather than sampled traces.
A tool in this category records five kinds of data per request:
- Request and response data: messages, parameters, tool calls, provider, and model
- Performance data: end-to-end latency, time to first token, and provider versus gateway time
- Usage and cost data: input, output, cached, and reasoning tokens, priced per model
- Attribution data: the virtual key, team, customer, project, or user behind the request
- Status data: success, error type, retries, and the credential that served the request
Bifrost records all five in its built-in request logs for chat, responses, embeddings, speech, transcription, and video generation requests.
Key Criteria for Evaluating LLM Observability Tools
Enterprise buyers should score LLM observability tools on seven criteria: capture method, latency decomposition, cost attribution to an organizational unit, metrics export, trace streaming, content controls, and alerting on budgets and limits. The LLM gateway buyer's guide covers the broader gateway evaluation; the table below isolates observability.
| Criterion | What to check | Why it matters for enterprises |
|---|---|---|
| Capture method | SDK per application, or capture at the gateway for every request | Instrumentation coverage decays as services are added; gateway capture is complete by construction |
| Latency breakdown | Provider time separated from gateway overhead, with overhead itemized | Otherwise every slow request looks like a provider problem |
| Cost attribution | Cost tagged with virtual key, team, customer, and project, not just model | Chargeback and budget enforcement need organizational dimensions |
| Metrics export | Prometheus, OTLP, or vendor metrics with a bounded label set | Dashboards and SLO alerts run on metrics, not log rows |
| Streaming export | Kafka, Pub/Sub, BigQuery, Splunk, or object storage | Enterprises already own a data platform and need traces in it |
| Content-logging controls | Prompt and response bodies droppable per destination while metadata continues | Compliance regimes restrict where content may land |
| Alerting | Rules on budgets and rate limits, dispatched to Slack, Teams, PagerDuty, or webhooks | Teams need to know before a budget is spent |
Capture method and cost attribution deserve extra weight. A tool that requires an SDK wrapper in each service will always miss the service nobody instrumented, and a cost total by model tells finance nothing about which product line to bill. Bifrost attaches virtual key, team, customer, and project identifiers to every log row, metric, and exported span because they are resolved at the gateway.
LLM Observability Tools Compared at a Glance
The five tools below cover the two architectural approaches enterprises evaluate in 2026: Bifrost observes traffic in the request path as a gateway, while Langfuse, Arize Phoenix, Datadog LLM Observability, and LangSmith are application-side tracing platforms fed by SDKs, auto-instrumentation, or OpenTelemetry. Cells marked "Not published" were not confirmed on the vendor's own documentation.
| Tool | Capture method | Self-hosted option | OpenTelemetry | Cost attribution by org unit | Content-logging control | Budget and rate-limit alerting |
|---|---|---|---|---|---|---|
| Bifrost | Gateway, no SDK required | Yes (open source, VPC, air-gapped) | OTLP export (GenAI conventions) and OTLP metrics | Virtual key, team, customer, project, user | Global, per-request, and per-connector switches | Yes, CEL rules to Slack, Teams, PagerDuty, webhooks |
| Langfuse | SDKs, framework integrations, OpenTelemetry | Yes (open source) | OTLP ingestion | Not published | Not published | Not published |
| Arize Phoenix | OpenTelemetry and OpenInference instrumentation | Yes (open source; Docker, Kubernetes, local) | OTLP ingestion | Not published | Not published | Not published |
| Datadog LLM Observability | Python SDK, auto-instrumentation, OTel GenAI conventions | No (SaaS) | OTel GenAI conventions supported | Not published | Sensitive-data scanning and redaction | Not published |
| LangSmith | SDK and framework integrations | Yes (cloud, hybrid, or self-hosted) | Not published | Not published | Not published | Not published |
The complete guide to LLM logging, OTel tracing, and observability in Bifrost covers the Bifrost column in configuration detail.
1. Bifrost
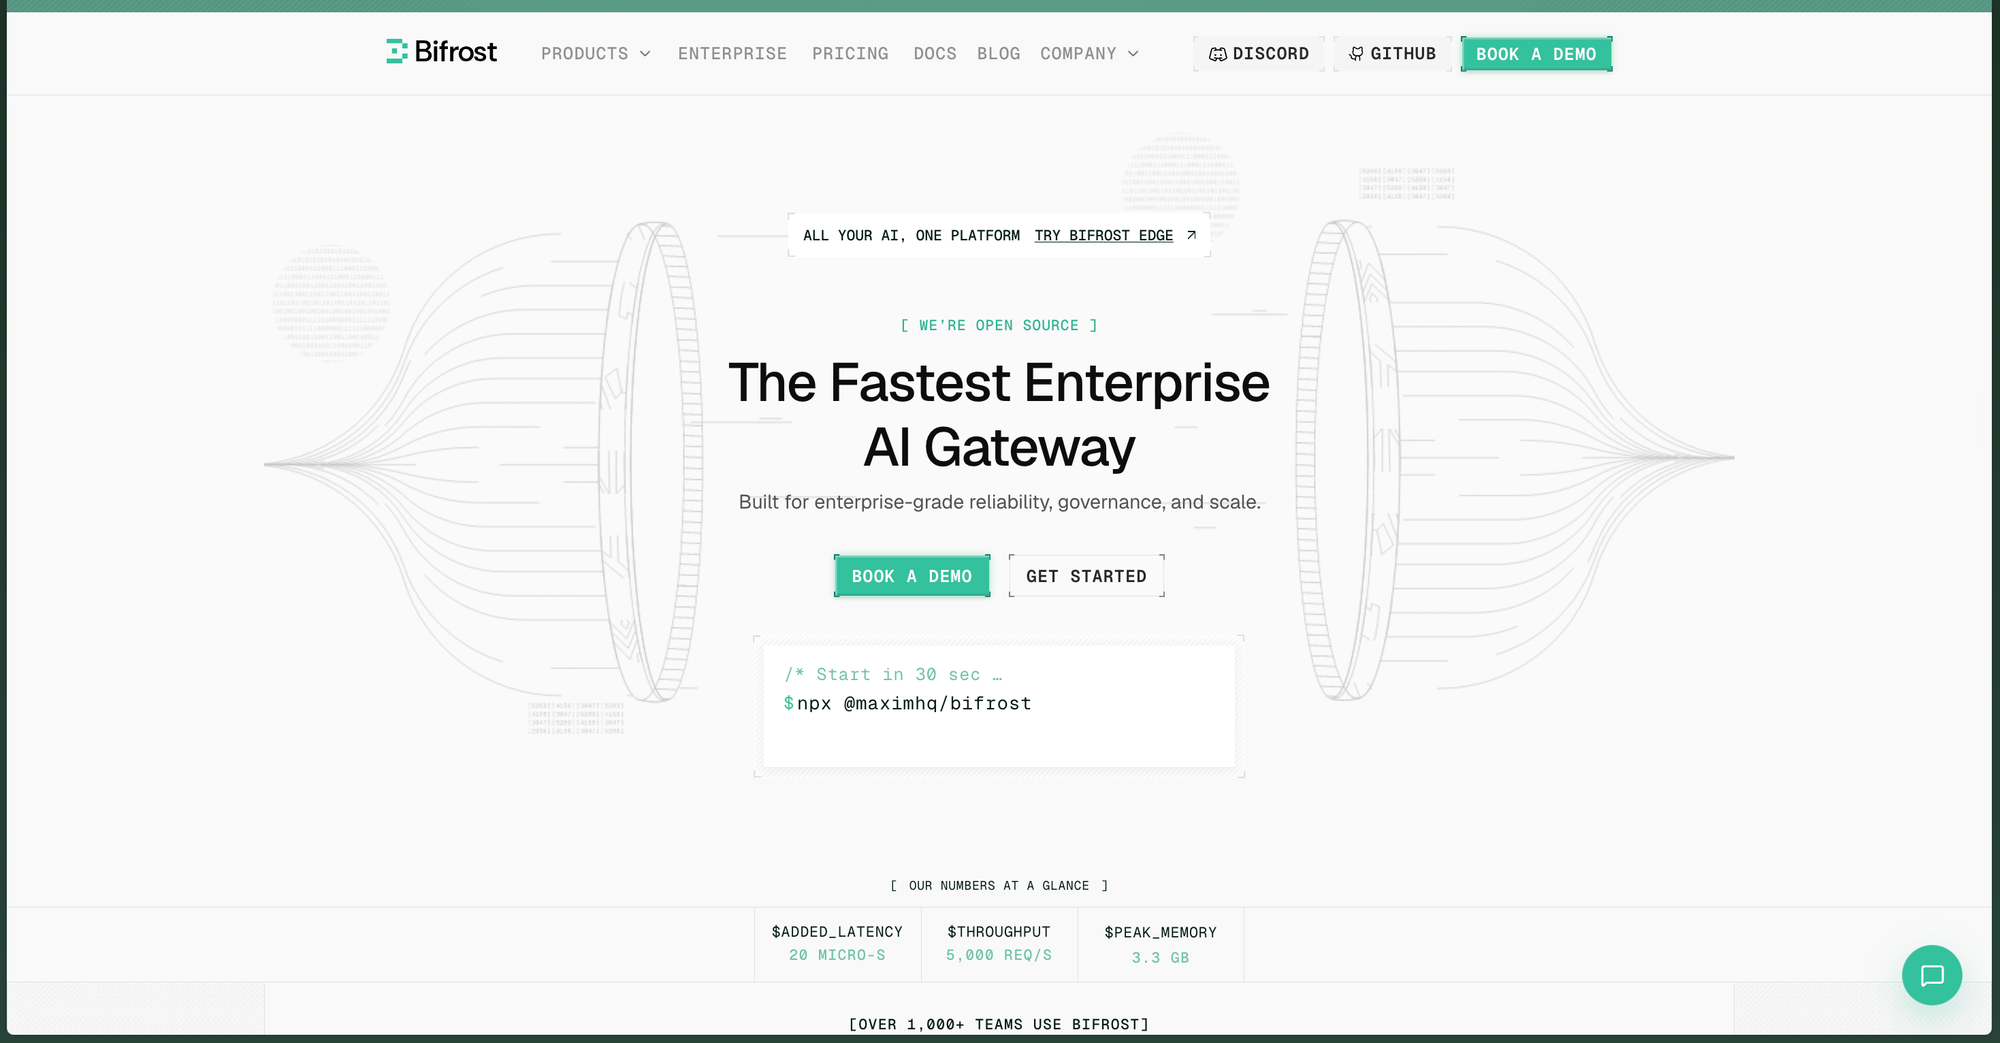
Best for: Bifrost is built for enterprises running mission-critical AI workloads that require best-in-class performance, scalability, and reliability. It serves as a centralized AI gateway to route, govern, and secure all AI traffic across models and environments with ultra low latency. Bifrost unifies LLM gateway, MCP gateway, and Agents gateway capabilities into a single platform. Designed for regulated industries and strict enterprise requirements, it supports air-gapped deployments, VPC isolation, and on-prem infrastructure. It provides full control over data, access, and execution, along with robust security, policy enforcement, and governance capabilities.
The Bifrost AI gateway observes LLM traffic from inside the request path. Applications point their existing SDKs at the gateway, and Bifrost records every request across 25+ providers and 10,000+ models without any change to application code. The gateway adds 11 microseconds of overhead per request at 5,000 RPS in sustained benchmarks, and the logging plugin writes asynchronously, so observability never sits on the critical path.
Request logs and traces
Every request produces a log entry with input and output messages, parameters, provider and model, tool calls, tokens, cost, latency, and status. The request log also records an ordered attempt_trail showing each retry, its failure reason, and whether it rotated to a different provider API key. Logs live in SQLite or PostgreSQL and are queried through the dashboard, a filterable REST API, or a WebSocket stream. Configured headers such as X-Tenant-ID, and any header prefixed x-bf-lh-, are captured into log metadata as correlation IDs.
Latency and overhead breakdown
Bifrost splits each request into upstream time (the provider's round trip and compute) and overhead (the gateway's own work), then decomposes overhead into named categories: serialization, conversion, plugins, middleware, key selection, processing, networking, client delivery, and miscellaneous. The latency and overhead breakdown appears in the log detail view whenever logging is enabled, measures each category as span self-time, and is also available as an opt-in per-component histogram.
Cost attribution per virtual key, team, and customer
Cost is calculated per request from model pricing and attached to the virtual key that authenticated the request, the team or customer that key belongs to, and the project the request was scoped to. Those identifiers travel as labels on Prometheus counters, attributes on exported spans, and columns in the BigQuery table. Budgets apply at the same virtual-key, team, and customer levels (rate limits at the virtual-key and provider-config levels), so the entity that is observed is the entity that is governed.
Prometheus metrics and OpenTelemetry export
The telemetry plugin exposes a /metrics endpoint and can push to a Prometheus Push Gateway for multi-node clusters. Prometheus metrics cover request, success, and error counters, upstream and overhead latency histograms, token and cost counters, cache hits, streaming latencies, and per-key health. Errors carry a closed error_type vocabulary prefixed by fault domain (caller_, policy_, provider_, bifrost_), so an SLO alarm that ignores caller mistakes is one label matcher. The OpenTelemetry connector exports traces to any OTLP collector over HTTP or gRPC using the OpenTelemetry GenAI semantic conventions, honors inbound W3C traceparent headers, and can group a multi-turn session into one trace via the x-bf-session-id header.
Datadog, Kafka, BigQuery, Pub/Sub, and Splunk connectors
The same traces can stream into an existing data platform. The Datadog connector sends APM traces, LLM Observability spans, and metrics through a local agent or directly to the Datadog API. The Kafka and Pub/Sub connectors publish each completed trace as a JSON message keyed by trace ID for downstream fan-out.
The BigQuery connector writes one denormalized row per request, partitioned by date and clustered by provider, model, and virtual key, with 15 token-detail columns. The Splunk connector ships flattened per-request events and the full metric set over HTTP Event Collector. Kafka, Pub/Sub, BigQuery, and Splunk are Bifrost Enterprise connectors.
Content-logging controls and log exports
Bifrost separates metadata (model, tokens, cost, latency, attribution) from content (prompts, completions, tool traffic) so teams can keep the first without the second. Content logging is controlled globally on the log store, per request via the x-bf-disable-content-logging header, and independently on each connector, because a log store with content disabled says nothing about what a BigQuery table or Datadog span contains. A retain_content_in_object_storage option keeps full payloads in a bucket that is never served back through the UI or API.
For long-term retention, log exports offload request and response payloads to S3 or GCS while the logs database keeps searchable metadata, with rows cleaned on a log_retention_days schedule that defaults to 365 days. Administrative activity is recorded separately in audit logs, which track who changed which configuration and when.
Alerting on budgets and rate limits
Alerting in Bifrost Enterprise evaluates CEL expressions such as budget_usage_percent > 80 against live governance metrics every 60 seconds, scoped to a virtual key, team, or customer, and dispatches to Slack, Microsoft Teams, PagerDuty, or any HTTP webhook, with cooldowns and a full alert history. Combined with the governance controls that set those budgets, this closes the loop from observation to enforcement in one system, deployable in a VPC or air-gapped environment through Bifrost Enterprise.
2. Langfuse
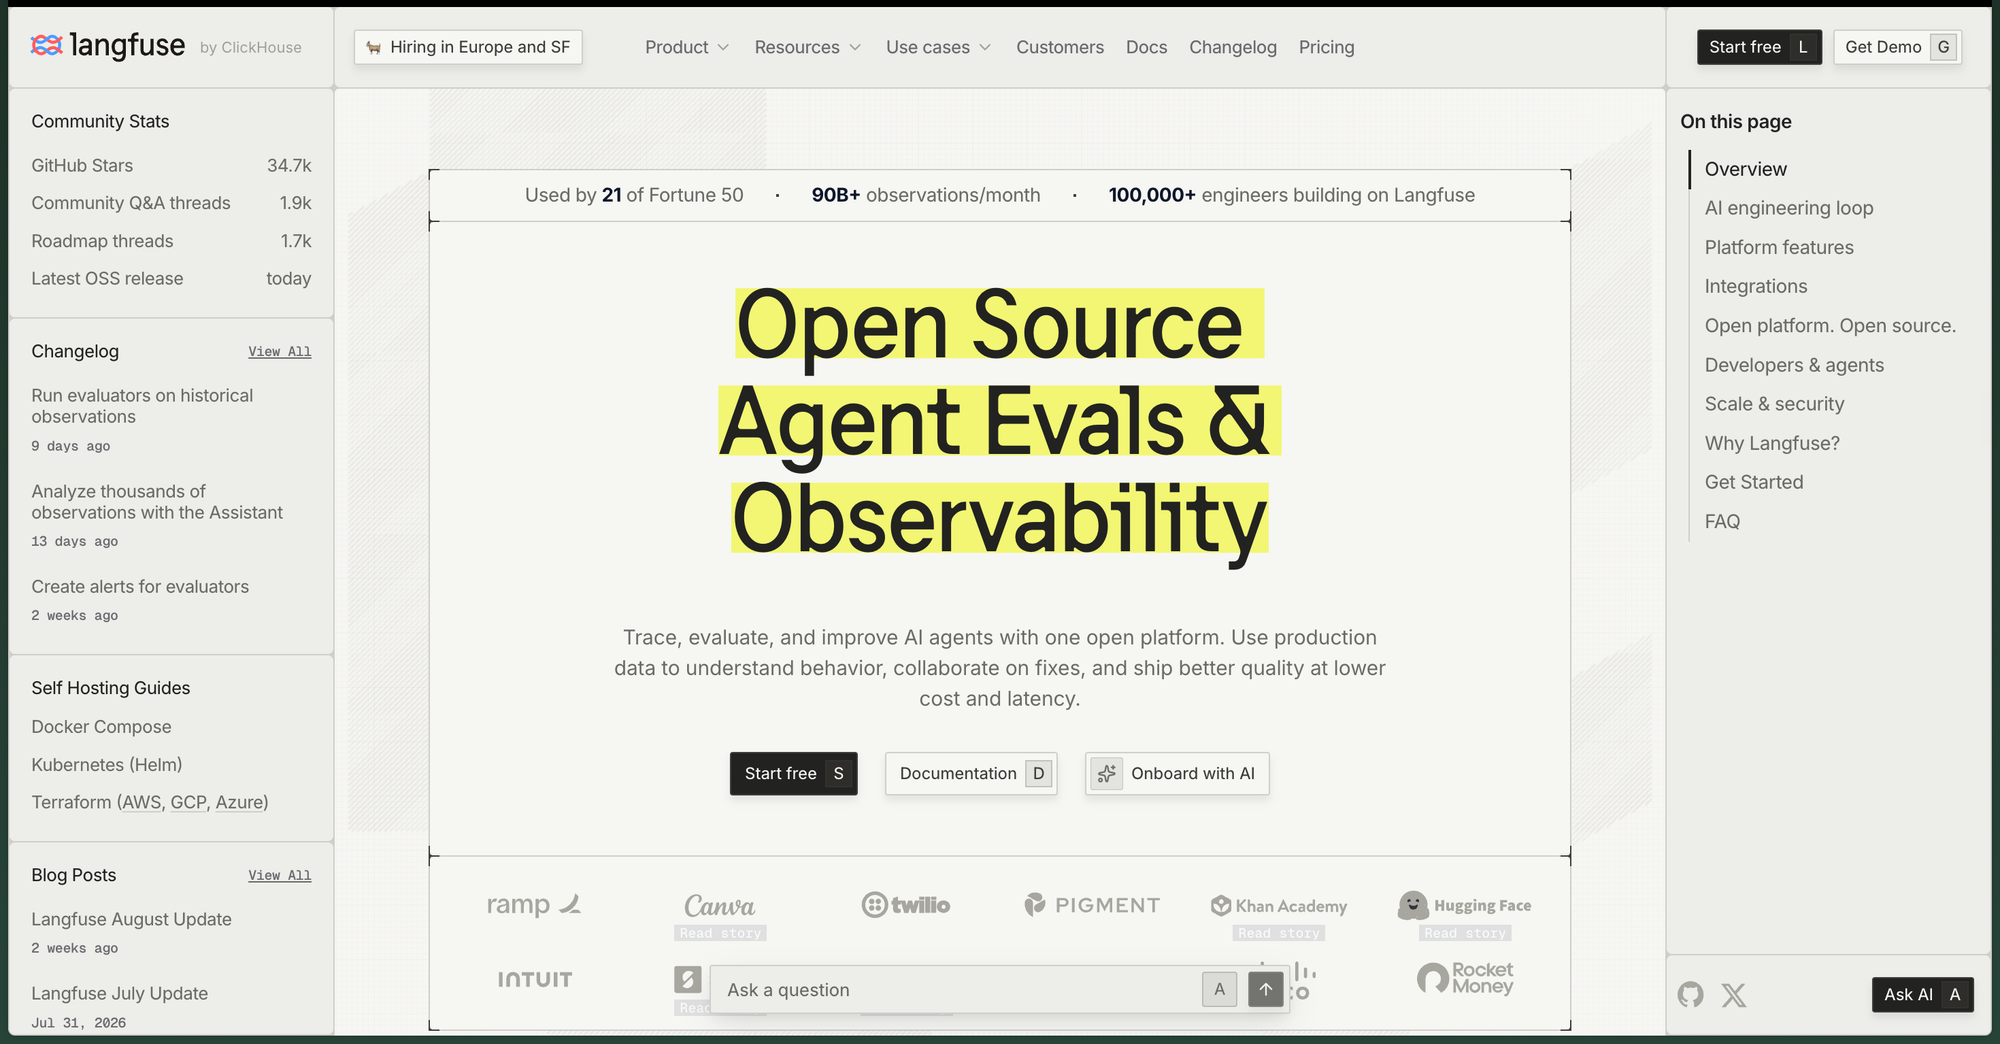
Best for: Engineering teams that want an open-source, self-hostable tracing and evaluation platform for agent applications and are prepared to instrument each application with an SDK or route traces through OpenTelemetry.
Langfuse describes itself as an open-source AI engineering platform for debugging, analyzing, and iterating on AI agent applications. It runs as a managed cloud service or a self-hosted installation, and its documentation states that trace data enters through Python and JavaScript SDKs, more than 100 framework integrations, OpenTelemetry, and LLM gateways.
The architectural consequence is that Langfuse observes what applications send it: coverage is as complete as the instrumentation, and cost and attribution depend on what each SDK reports. For per-trace debugging and evaluation of agent runs, that model fits well. For a complete, attributed record of all model traffic, Langfuse works best downstream of a gateway that already captures every request, and Bifrost's OTLP export feeds such a backend without additional application code.
3. Arize Phoenix
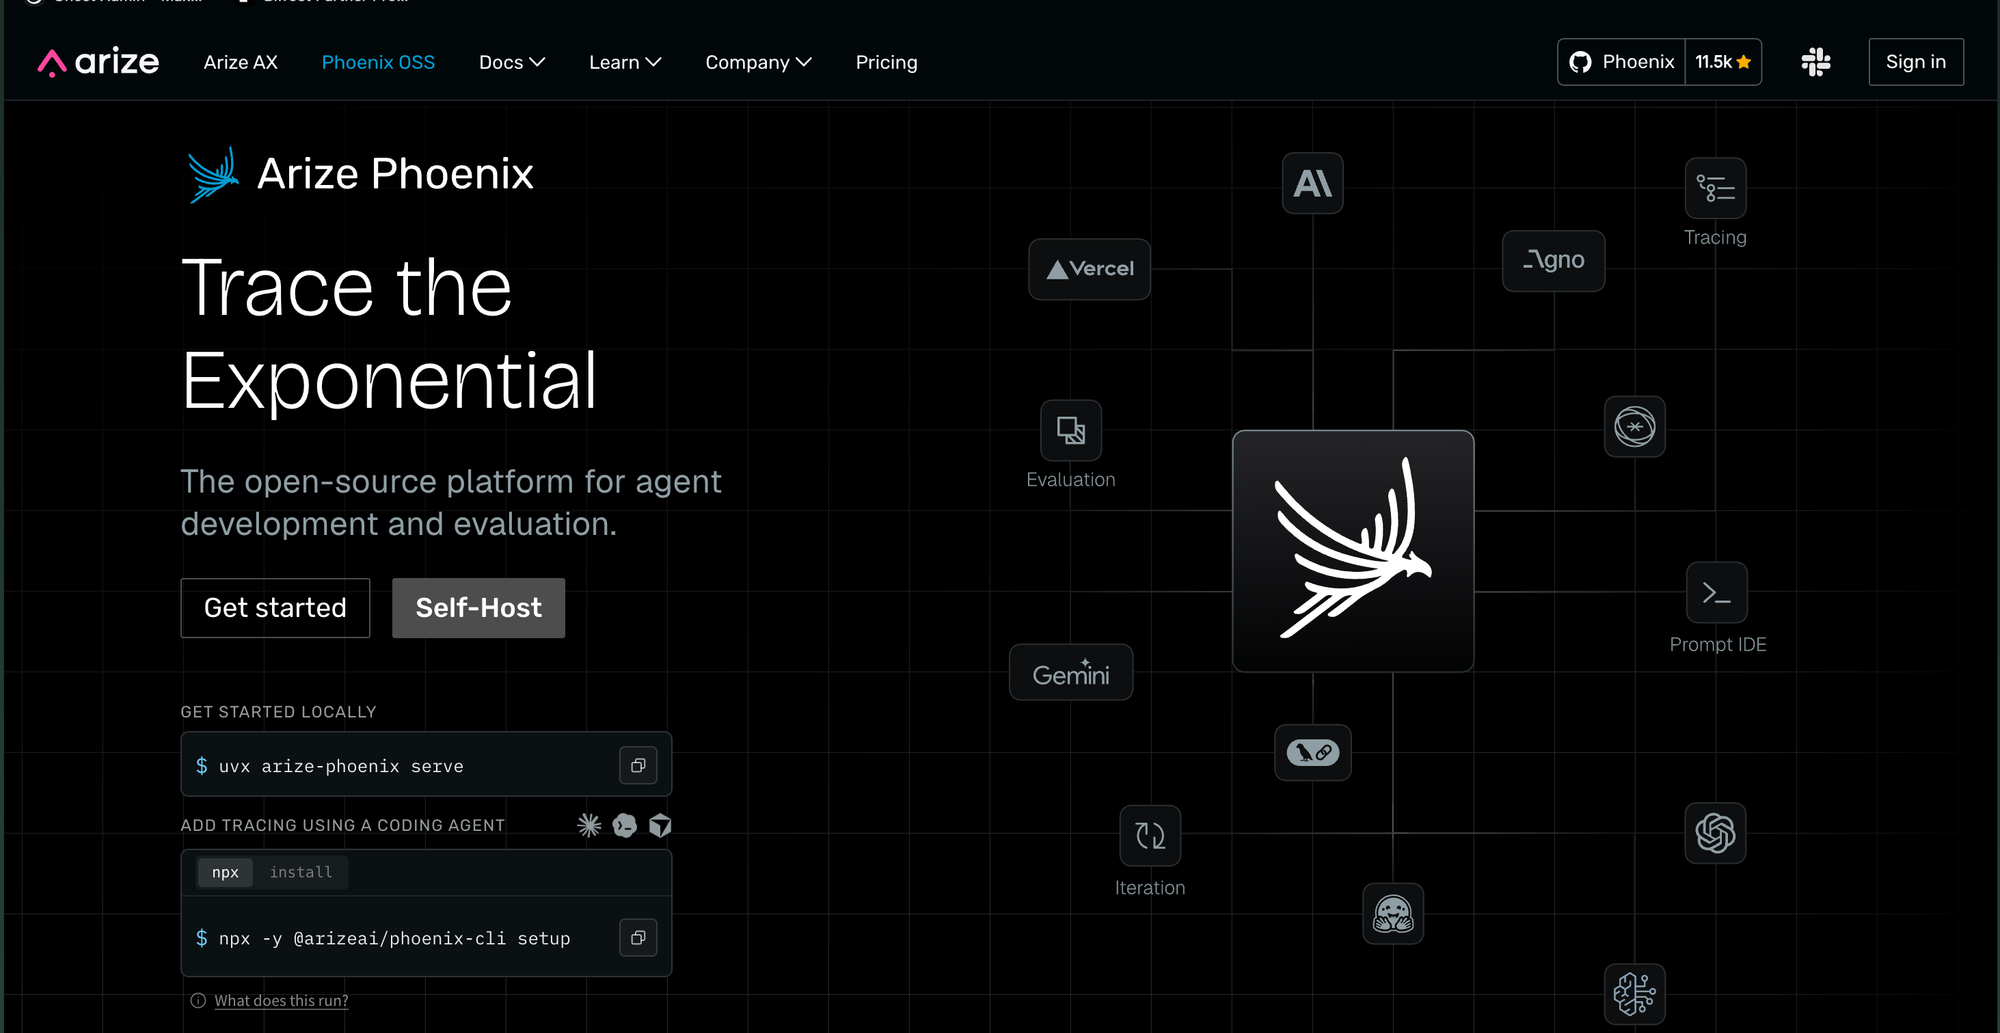
Best for: Teams standardizing on OpenTelemetry and OpenInference who want an open-source tracing and evaluation tool they can run locally, in Docker, or on Kubernetes.
Arize Phoenix is an open-source AI observability platform built by Arize AI and the open-source community. Its documentation covers tracing, evaluation, prompt iteration, and experiments, and confirms self-hosting on Docker, Kubernetes, or cloud platforms as well as a single-command local run. Data enters through OpenTelemetry (OTLP) and OpenInference instrumentation, with auto-instrumentation for frameworks such as LlamaIndex, LangChain, and DSPy. Arize AX is the separate managed enterprise platform built on the same standards.
Phoenix is a clean fit for an OTLP-first enterprise because it does not require a proprietary SDK, which also makes it a natural downstream for gateway traces: Bifrost exports OTLP spans in the GenAI convention today and lists OpenInference as a planned trace format. Teams evaluating this combination should read the gateway-level view of what to measure and where before deciding which layer owns cost attribution, since Phoenix's documentation does not publish organizational cost dimensions.
4. Datadog LLM Observability
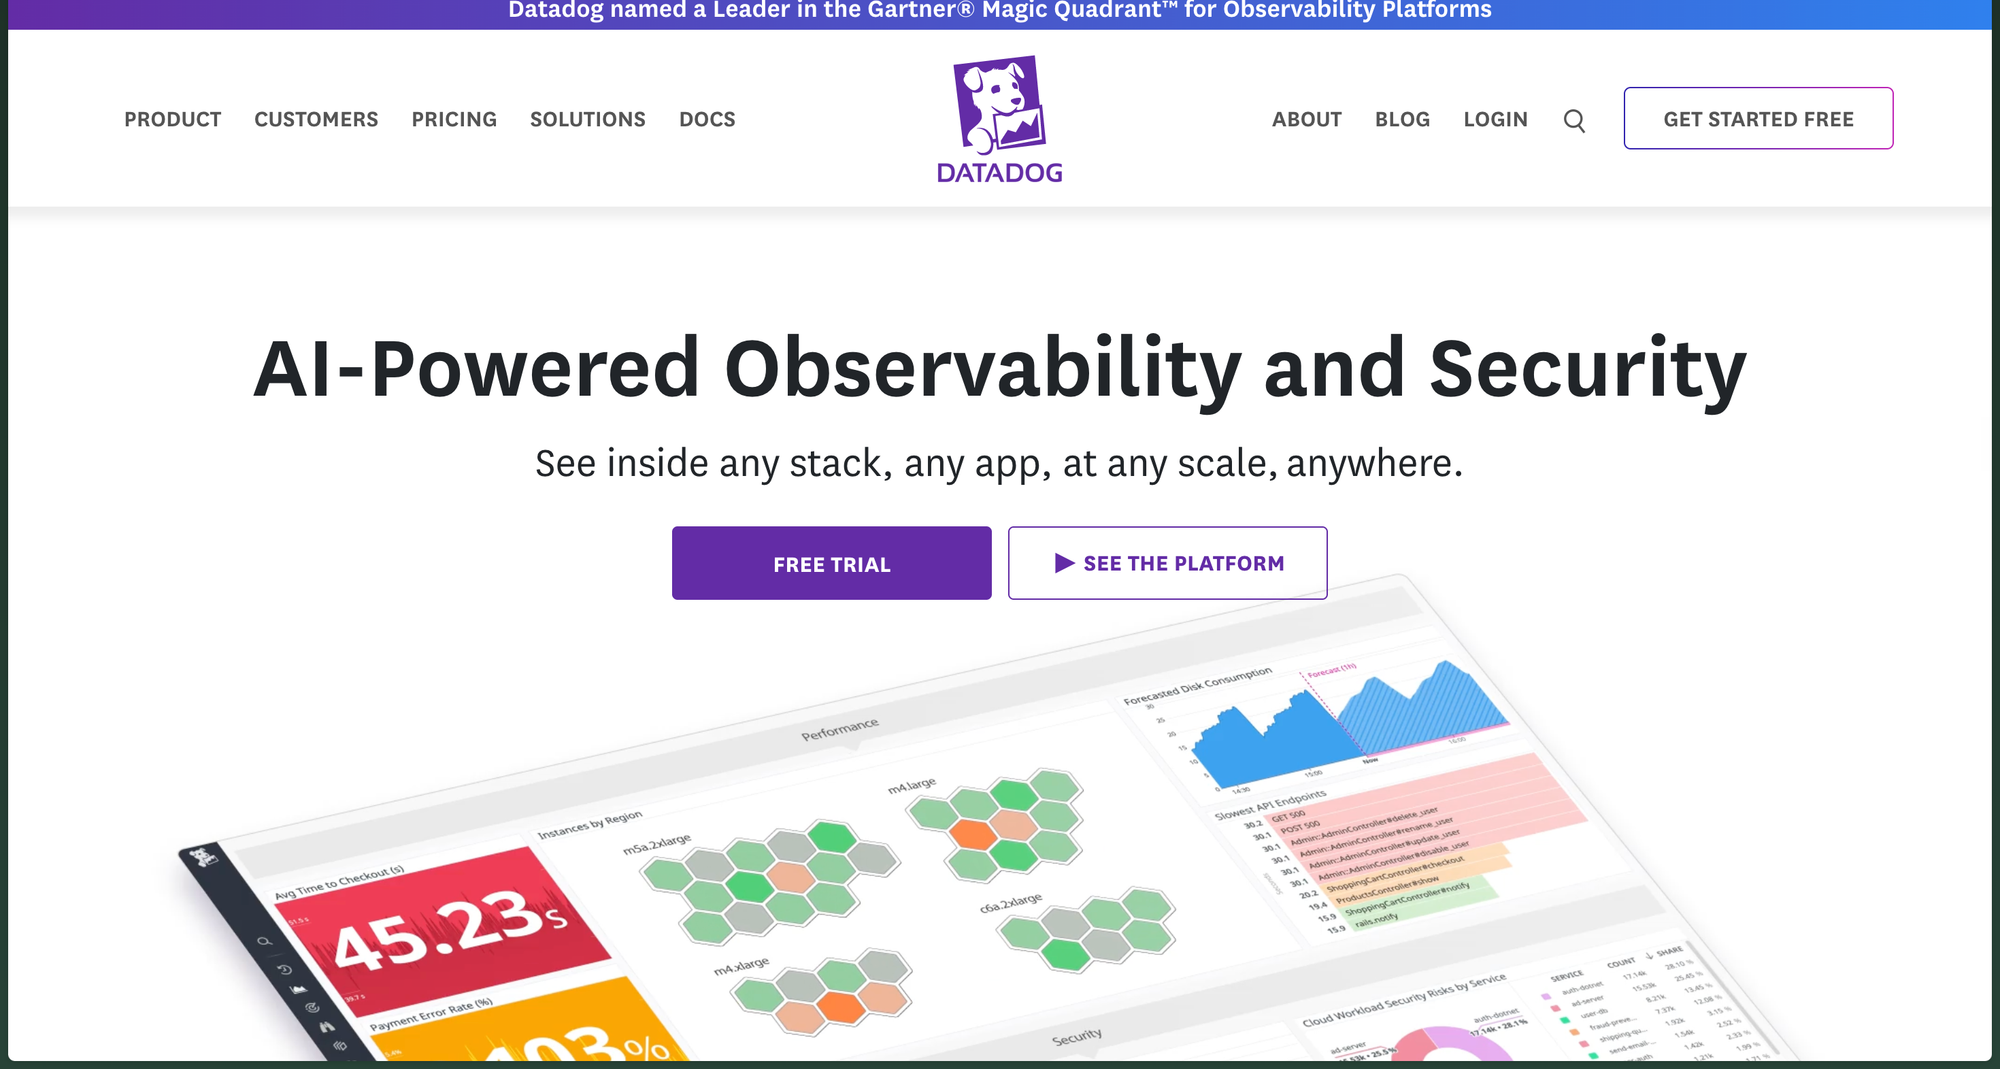
Best for: Organizations already standardized on Datadog for infrastructure and APM who want LLM traces, evaluations, and sensitive-data scanning in the same console.
Datadog LLM Observability is a SaaS product accessed through the Datadog cloud platform for investigating root causes, monitoring operational performance, and evaluating quality, privacy, and safety of LLM applications. Data arrives through a Python SDK that auto-instruments frameworks including OpenAI, LangChain, AWS Bedrock, and Anthropic, and the product natively supports the OpenTelemetry GenAI semantic conventions. Built-in evaluations detect prompt injections and scan and redact sensitive data.
Datadog is the one platform here that Bifrost integrates with natively. The Bifrost Datadog connector uses Datadog's own SDK to emit APM traces with W3C Trace Context, LLM Observability spans grouped under an ML App, and metrics via DogStatsD or the Metrics API, in agent or agentless mode. For an enterprise that wants Datadog dashboards without adding the Datadog SDK to each service, the gateway is the shorter path. Retention and pricing are set by Datadog, which is why monitoring LLM costs in a system the enterprise controls usually runs alongside it.
5. LangSmith
Best for: Teams building on LangChain or LangGraph, or teams that want tracing, evaluation, prompt engineering, and deployment features from one vendor with cloud, hybrid, or self-hosted options.
LangSmith provides visibility from individual traces to production-wide metrics, with trace filtering and export, dashboards, automated workflows, user feedback collection, and issue detection. Its documentation states that it works with many frameworks and providers beyond LangChain, including OpenAI, Anthropic, and CrewAI, and that cloud, hybrid, and self-hosted deployments all include observability, evaluation, prompt engineering, and deployment features.
LangSmith's data enters through its SDK and framework integrations, so the platform sees the applications that were instrumented. Its documentation does not publish OpenTelemetry ingestion details, organizational cost attribution, or budget alerting, which is why those cells read "Not published" above. Pairing LangSmith with a gateway gives application-level traces from LangSmith and a complete, governed record of model traffic from the gateway, with cost tracking across teams handled where budgets are enforced.
Common Challenges with SDK-Instrumented LLM Tracing
SDK-instrumented LLM tracing fails enterprises in predictable ways: coverage gaps as new services skip instrumentation, cost figures that depend on each integration's token reporting, no separation of provider latency from gateway overhead, and content shipped to a SaaS backend by default. A gateway addresses each structurally because the data is generated where every request already passes.
| Challenge | How it shows up | Gateway-layer resolution |
|---|---|---|
| Coverage gaps | A new service ships without the tracing decorator; its spend is invisible | Every request through the gateway is logged; no per-service step to forget |
| Inconsistent cost data | Integrations report tokens differently, or not at all for streaming | Cost is computed once at the gateway from usage and model pricing |
| Latency blame | Slow requests are blamed on the provider with no evidence | Upstream time and gateway overhead are recorded separately |
| Attribution mismatch | Traces carry a service name, not the team or customer to bill | Attribution is resolved from the virtual key before the request leaves |
| Content leakage | Prompts land in a vendor's store by default | Content is disabled per destination while metadata continues |
| Observation without enforcement | The dashboard shows an overspend after the month closes | Budget alerts fire from the governance store that enforces limits |
The last row distinguishes LLM monitoring tools from an LLM observability platform embedded in the gateway: paging the owner at 80 percent of budget and refusing the request at 100 percent is what finance asked for. Teams comparing tools for LLM cost and usage monitoring should check whether the tool can act on what it observes.
One caveat applies. Gateway observability records model calls, not the application logic between them; an agent that makes six model calls and four database queries shows six spans from the gateway, and the application-side platforms above fill in the rest. Session grouping via x-bf-session-id and W3C Trace Context propagation make that join straightforward, and metric labels stay bounded per Prometheus naming practice.
Frequently Asked Questions
What is the difference between LLM monitoring and LLM observability?
LLM monitoring tracks aggregate signals such as request rate, error rate, p95 latency, and daily spend. LLM observability keeps per-request detail (messages, parameters, tokens, cost, latency breakdown, and attribution) so an engineer can explain why a monitored signal changed. Bifrost provides both: Prometheus metrics for monitoring and full request logs and traces for observability, generated from the same request path.
What are the five pillars of LLM observability?
Vendors define the pillars differently, but the recurring set is traces, metrics, logs, cost, and evaluation. At the gateway layer, the first four are captured automatically for every request: traces exported over OTLP, Prometheus metrics, per-request logs with content controls, and cost attributed to virtual keys, teams, and customers. Evaluation of output quality is an application-side concern that the tracing platforms in this list address on top of gateway data.
Do LLM observability tools require code changes?
Application-side tools do: Langfuse, Arize Phoenix, Datadog LLM Observability, and LangSmith all ingest data through an SDK, an auto-instrumentation package, or an OpenTelemetry exporter configured in the application. Bifrost does not require instrumentation, because applications already send requests through the gateway; changing the SDK base URL is the only change, and the drop-in replacement docs cover the supported SDKs.
Can LLM observability tools track cost per team or customer?
Only if the identity of the caller is known at capture time. Bifrost resolves the virtual key on each request and stamps the associated team, customer, and project onto log rows, Prometheus labels, exported spans, BigQuery columns, and Splunk events, and the same identifiers drive budget enforcement. Application-side platforms can carry a user or session ID if the application passes one, but organizational cost dimensions were not published in the documentation reviewed for the other four tools.
How does an AI gateway export traces to existing observability platforms?
Bifrost exports traces over OTLP (HTTP or gRPC) using the OpenTelemetry GenAI semantic conventions, so Grafana Cloud, New Relic, Honeycomb, or any OTLP-capable backend can receive them, and it has native connectors for Datadog, Kafka, Pub/Sub, BigQuery, and Splunk. Each connector has its own content-logging switch; the OpenTelemetry docs describe span attributes, session grouping, and plugin-span filtering.
Try Bifrost Today
The LLM observability tools an enterprise chooses in 2026 should produce complete, attributed request data first and layer evaluation tooling second. Bifrost captures every request across 25+ providers with no SDK instrumentation, separates provider latency from gateway overhead, attributes cost to the virtual key, team, and customer, and exports the result to seven destinations with per-destination content controls and budget alerting.
Deploy the open-source gateway to see request logs and the overhead breakdown on your own traffic, browse the Bifrost resources hub, or book a demo to walk through the Enterprise connectors, alerting, and log exports with the Bifrost team.