Tracing AI Agent Failures: Debugging Multi-Step Tool Workflows
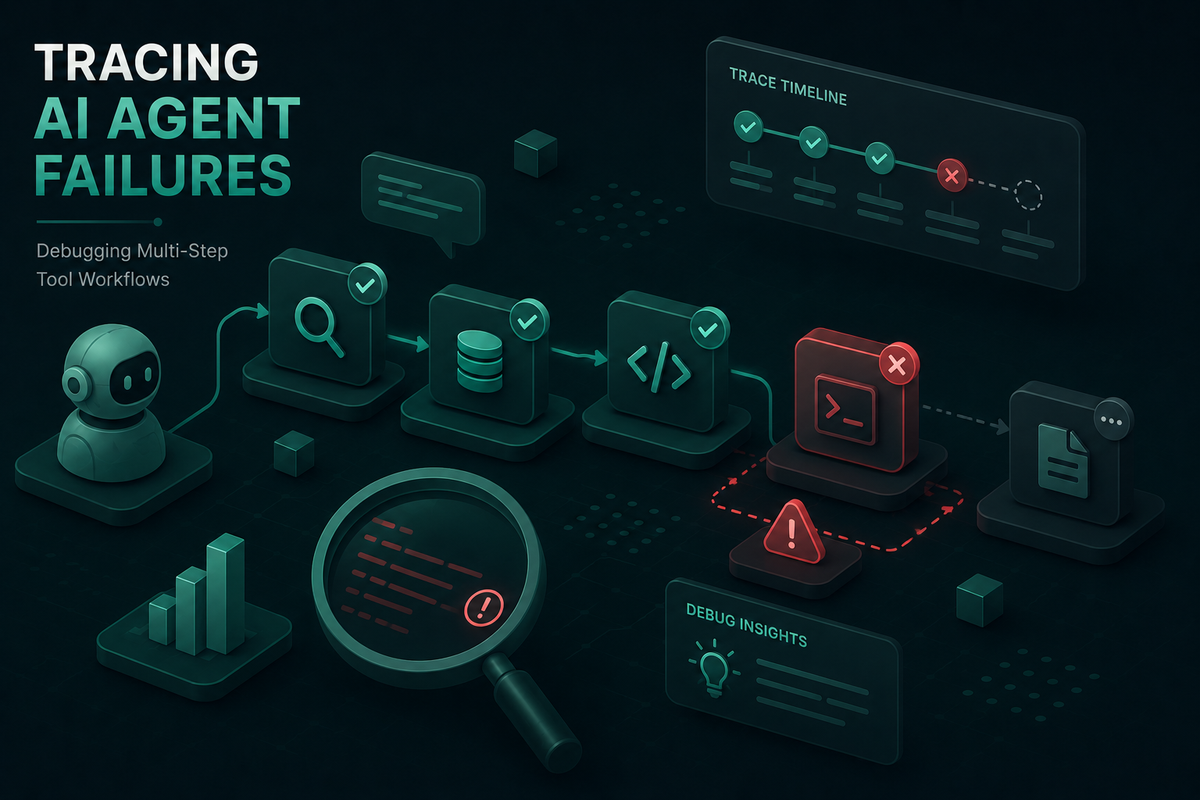
When AI agents fail in production, logs alone are not enough. Learn how distributed tracing exposes failure points across multi-step tool workflows.
When a deterministic service breaks, you get a stack trace. When an AI agent breaks, you get a clean response that is silently wrong. Tracing AI agent failures is the only reliable way to recover the missing context: which tools were called, in what order, what they returned, and where the reasoning veered off course. This is especially true for agents that orchestrate multi-step tool workflows, where a bad decision at step two only surfaces as a user-visible failure ten spans later. Maxim AI provides the agent observability layer purpose-built for this problem, with distributed tracing, span-level evaluation, and replayable sessions for production agent traffic.
Why AI Agent Failures Are Hard to Debug
AI agents fail differently from traditional software. A single user query can fan out into a dozen LLM calls, tool invocations, and retrievals before producing an answer, and the failure mode is rarely an exception. The agent picks the wrong tool, hallucinates an argument, misreads a retrieval result, or loops on an error. Standard application performance monitoring shows latency and error rates, but it has no view into the reasoning between input and output.
Three properties make these failures resistant to traditional debugging:
- Non-determinism: The same input can produce different tool call sequences across runs, so failures are not always reproducible on demand.
- Multi-step causality: A failure observed at step eight was often caused by a bad decision at step two, which means single-span logs are not enough.
- Silent corruption: A tool can return a successful HTTP status with empty or malformed data, and the agent will proceed without flagging anything.
Guidance from the OpenTelemetry GenAI observability community emphasizes that diagnosing modern AI applications requires visibility into prompts, completions, tool arguments, and tool results, not just request-level metrics. Tool calls and retrievals carry the actual evidence; the model output is just the surface.
What Distributed Tracing Looks Like for AI Agents
Distributed tracing for AI agents extends the same concepts used in microservices, with GenAI-specific spans for model calls, tool executions, and retrievals. The OpenTelemetry community has formalized this through the GenAI semantic conventions, which define standard span types like invoke_agent, chat, and execute_tool {tool_name}, along with attributes for model name, token counts, tool arguments, and tool results.
Maxim implements distributed tracing for AI applications around three core entities:
- Sessions represent end-to-end task executions and group every turn of a multi-turn agent run. A session captures how context evolves as the agent plans, reasons, executes, and responds.
- Traces capture a single request lifecycle inside a session: the LLM calls, tool calls, retrievals, and any nested sub-agent activity.
- Spans are the individual units of work inside a trace. Each tool call, retrieval, and generation is a separate span with inputs, outputs, latency, cost, and metadata.
Logs flow into log repositories, which act as searchable, filterable stores per application or environment. Repositories can be split by service, environment, or team so production traffic for a customer support agent stays separate from a finance ops agent. Maxim also supports OpenTelemetry ingestion for teams that already emit GenAI spans through OTel SDKs, with forwarding to backends like New Relic or Snowflake.
Common Failure Modes in Multi-Step Tool Workflows
Most agent failures in production fall into a handful of recurring patterns. Recognizing them in a trace is the first step to fixing them.
- Wrong tool selection: The agent picks a semantically adjacent tool instead of the correct one. The span tree shows a successful call to a tool that should never have been invoked for this query.
- Malformed tool arguments: The model generates arguments that do not match the tool schema. The tool span records a validation error or, worse, executes with truncated or coerced inputs.
- Silent empty responses: A tool returns HTTP 200 with an empty body. The agent proceeds as if the call succeeded, and the corruption propagates downstream.
- Retrieval pollution: The retrieval span returns chunks that look relevant but contradict the user query, and the agent dutifully reasons from bad context.
- Loops and retry storms: The agent retries the same failing tool call repeatedly, burning tokens and time. Without a step budget, this can run until rate limits intervene.
- Context loss across turns: In long sessions, earlier constraints or facts drop out of context. The trace shows the agent confidently violating a rule established ten turns ago.
- Handoff drops: In multi-agent systems, the orchestrator passes incomplete context to a sub-agent, and the sub-agent answers a different question than the user asked.
Each of these is invisible in single-span logs but obvious in a properly structured trace. The trace shows the exact step where the chain broke, the inputs at that step, and the propagation that turned a local error into a user-facing failure.
How Maxim Traces AI Agent Failures
Maxim's observability platform captures the complete request lifecycle for every agent run. The platform records LLM requests and responses, tool and API calls, retrieval operations, multi-turn conversation flows, and sub-agent invocations as a connected trace graph. This is the distributed tracing model that production AI teams use to identify failure modes, uncover edge cases, and diagnose root causes.
Specific capabilities that matter for debugging multi-step tool workflows:
- Tool call spans as first-class entities: Each tool execution is logged separately with its inputs, outputs, latency, and status. You can filter a trace view to "all failed tool calls in the last 24 hours" and inspect every one.
- Retrieval spans: Retrieval operations against vector stores or knowledge bases are captured with the query, the returned chunks, and the relevance metadata. This is essential for diagnosing RAG failures inside agent workflows.
- Session-level trajectory view: A session groups every trace across multi-turn execution, so you can see the full trajectory of an agent run rather than fragmented single-turn logs.
- SDK and framework coverage: Native integrations for OpenAI Agents SDK, LangGraph, CrewAI, LiveKit, and others mean instrumentation lands at the right span boundaries automatically.
- Real-time alerts: Configure thresholds on token usage, latency, cost per request, or quality scores and route alerts to Slack, PagerDuty, or OpsGenie when production behavior drifts.
The result is a debugging workflow where the failure is reconstructable from the trace alone. No local reproduction, no guessing about which prompt or tool argument caused the regression.
Debugging a Multi-Step Tool Workflow Step by Step
Consider an e-commerce support agent that handles a customer's refund request. The workflow looks up the customer, fetches their order history, validates refund eligibility, processes the refund, and sends a confirmation. A user reports that refunds are silently failing for repeat customers.
Here is how a Maxim-traced debugging session unfolds:
- Filter for the affected sessions. Open the log repository for the support agent and filter on the customer segment or session metadata that matches the report. Maxim surfaces all matching sessions ranked by recency.
- Inspect the trajectory. Open a failing session and view the trace tree. The span graph shows each tool call in order, with status, latency, and cost. The visualization makes it immediately clear which span returned an error or unexpected output.
- Locate the failing span. Drill into the suspect span. The
lookup_customertool returned a valid response, but thefetch_order_historyspan shows an empty array when the customer clearly has orders. The trace makes the silent empty response visible. - Confirm the cause. Check the tool call arguments. The agent passed a customer ID with leading whitespace because the LLM included surrounding quotes from the original message. The tool returned no matches and reported success.
- Attach an evaluator. Configure a tool selection or step completion evaluator at the span level so the next regression is caught automatically. Evaluators run on production logs without disrupting active sessions.
- Reproduce in simulation. Re-run the same scenario through Maxim's simulation engine with the fix applied, across multiple personas, to confirm the failure no longer surfaces before deploying the change.
This is the loop that turns reactive firefighting into systematic improvement: trace, diagnose, evaluate, simulate, ship.
From Tracing to Prevention
Tracing alone tells you what happened. Closing the loop requires turning each diagnosed failure into a regression test and a guardrail.
Maxim supports this through three connected capabilities:
- Evaluators at session, trace, or span level: Off-the-shelf evaluators for task success, trajectory quality, tool selection, step completion, faithfulness, and context relevance, plus support for custom LLM-as-a-judge, programmatic, and statistical evaluators. Configure them where the failure surfaced and they run automatically on every future trace.
- Dataset curation from production logs: Convert failing traces into evaluation datasets that travel with your CI loop. This is the bridge between an incident and a permanent regression check.
- Simulation against scenarios and personas: Re-run candidate agent versions through synthetic conversations that exercise the exact failure mode before deployment, with assertions on behavior rather than exact-match outputs.
For deeper context on how this connects to broader agent quality work, Maxim's writeup on evaluation workflows for AI agents and the companion piece on AI agent evaluation metrics walk through how teams structure the full lifecycle.
Start Debugging AI Agents with Maxim
Multi-step tool workflows are where AI agents either earn user trust or quietly destroy it. Tracing AI agent failures with distributed tracing, span-level visibility, and connected evaluators is the only way to keep these systems honest at scale. Maxim AI gives engineering and product teams a shared platform for tracing, debugging, evaluating, and preventing the failure modes that production agents actually exhibit.
To see how Maxim AI accelerates agent debugging and observability for production workloads, book a demo or sign up for free and instrument your first agent in minutes.