Top 9 AI Observability Platforms for Enterprises in 2026
AI observability platforms record the prompts, responses, tokens, cost, latency, and tool calls of production AI traffic. This guide compares nine of them, including Bifrost, Datadog LLM Observability, Arize AI, and Langfuse, on capture method, OpenTelemetry, and deployment.

TL;DR
- AI observability platforms capture inputs, outputs, tokens, cost, latency, and errors for LLM calls, MCP tool calls, and agent operations, then make that data searchable and alertable.
- Bifrost captures AI traffic at the gateway layer, attributes it to virtual keys, teams, customers, and projects, and exports it over OpenTelemetry, Prometheus, Datadog, BigQuery, Kafka, Pub/Sub, and Splunk.
- APM platforms (Datadog, Dynatrace, New Relic) place LLM spans next to service traces; LLM-native platforms (Arize AI, Langfuse, LangSmith, W&B Weave) add evaluations and prompt workflows; Fiddler adds guardrails and ML monitoring.
- A common enterprise pattern is two layers: a gateway that captures and attributes every AI request, and one or more AI observability platforms where traces are stored and analyzed.
AI observability platforms record what AI systems do in production: the prompts and responses, token usage, cost, latency, and errors of each model call, plus the tool calls and agent operations around them. Bifrost, the open-source AI gateway built by Maxim AI, is the best choice for enterprises running mission-critical AI workloads that require top-tier performance, scalability, and reliability, because it captures LLM, MCP, and agent traffic in the request path and exports it to the tools teams already run. This guide compares nine AI observability platforms on how data reaches them, OpenTelemetry support, cost attribution, agent coverage, and deployment, and explains where gateway-layer AI observability fits beside them.
What an AI Observability Platform Covers
An AI observability platform collects telemetry from AI workloads and turns it into searchable logs, traces, metrics, and alerts. For enterprises, that telemetry has to cover three kinds of traffic (model calls, MCP tool calls, and agent-to-agent calls) and carry enough attribution to answer who spent what, on which model, and why a request failed.
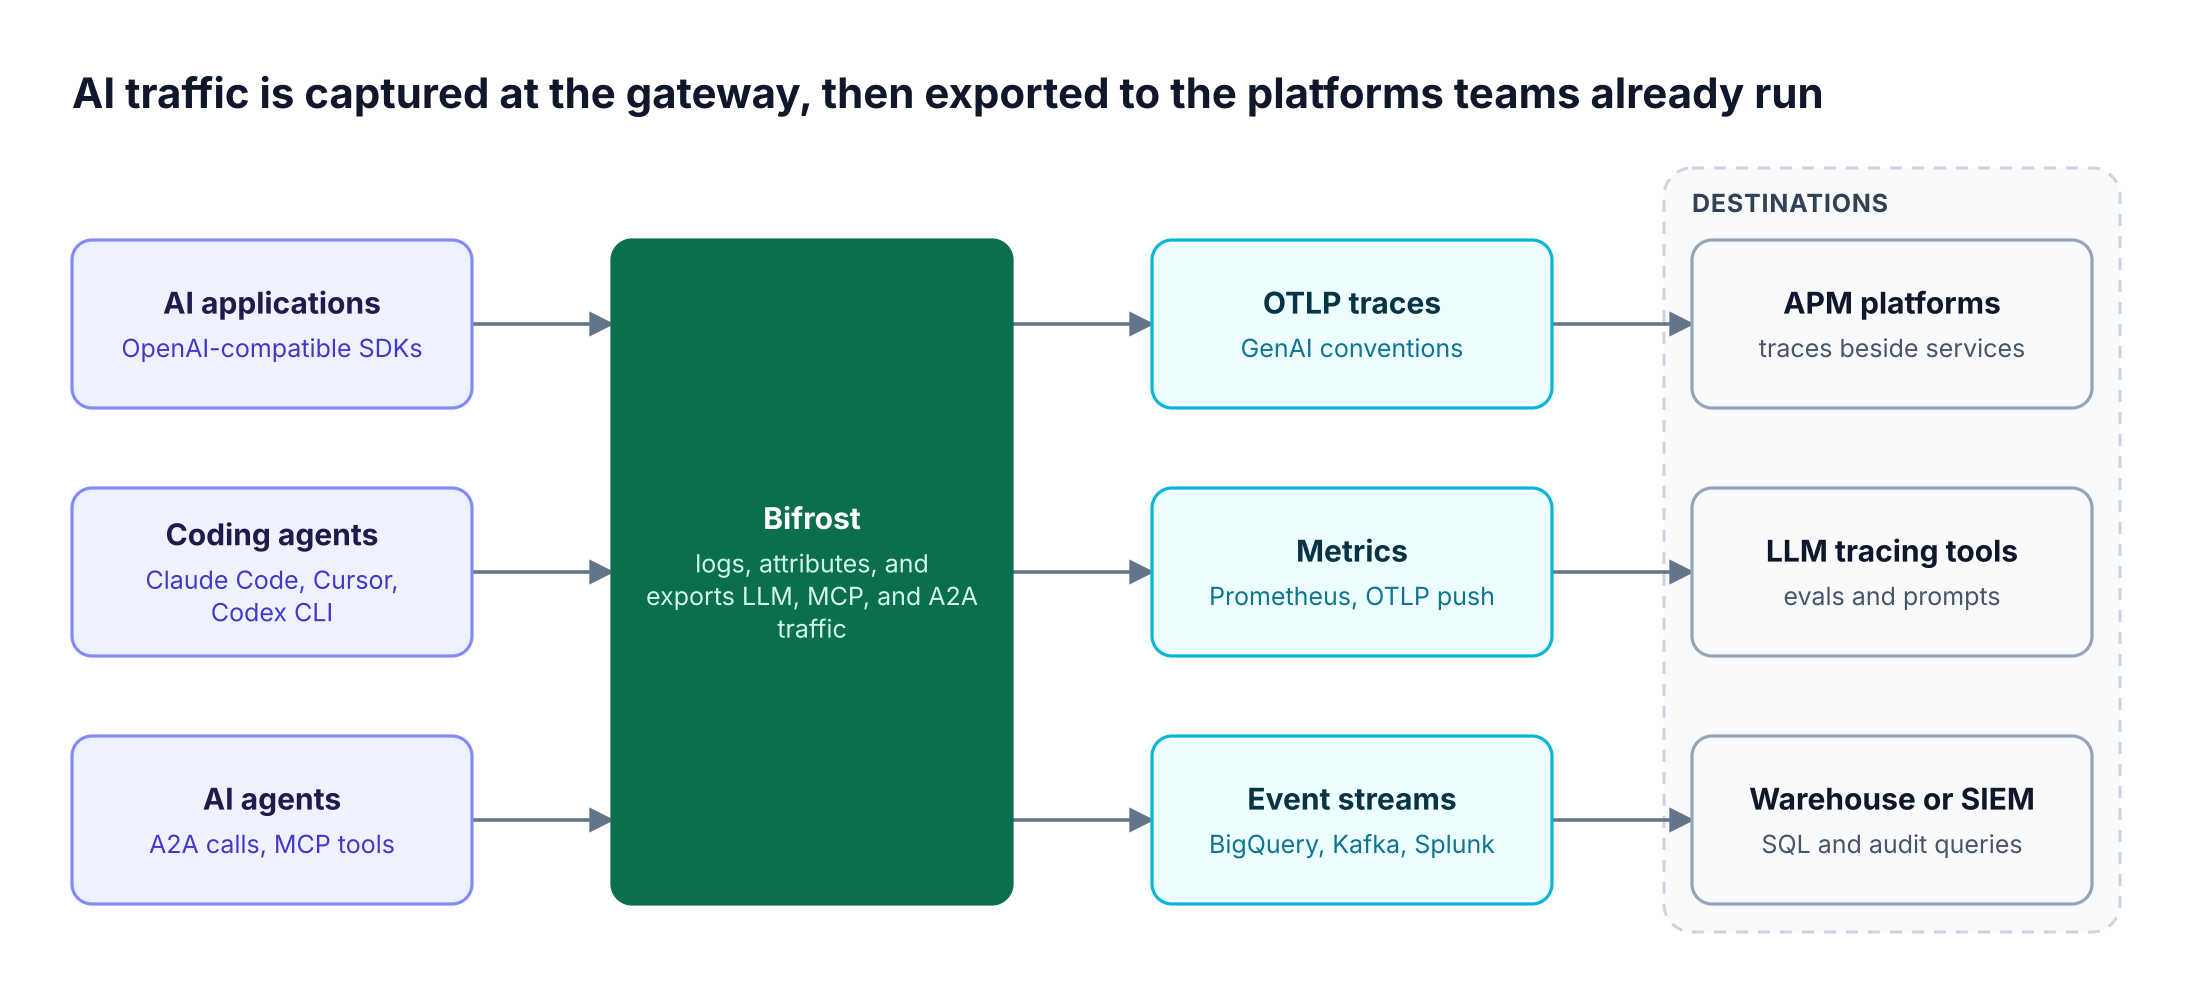
The platforms on this list differ mainly in where they sit. Some are destinations: they receive spans from SDKs, agents, or OpenTelemetry collectors and provide dashboards, evaluations, and alerting. The Bifrost AI gateway is a capture point: every request already passes through it, so it can log and attribute traffic without application instrumentation. As Figure 1 shows, the two roles connect rather than compete.
For a deeper walkthrough of request logging, OTLP export, and metrics at the gateway, see the complete guide to LLM logging and OpenTelemetry tracing in Bifrost.
Key Criteria for Evaluating AI Observability Tools
Enterprise teams evaluating AI observability tools should check five things: how data gets in, whether it follows OpenTelemetry, how cost is attributed, whether agents and tools are covered, and where the data is stored. The table below lists what to verify for each.
| Criterion | Why it matters | What to verify |
|---|---|---|
| Capture method | SDK instrumentation misses traffic that skips the SDK | Gateway capture, SDK, agent, or OTLP ingest |
| OpenTelemetry | Avoids lock-in to one backend | OTLP export or ingest, GenAI semantic conventions |
| Cost attribution | Chargeback needs per-team and per-customer spend | Labels for key, team, customer, project, user |
| Agent and tool coverage | Agent failures often start in a tool call | MCP spans, A2A operations, session correlation |
| Data residency | Prompts can contain regulated data | Self-hosted, VPC, air-gapped, per-destination content controls |
Attribution decides whether chargeback and incident triage work at all. In Bifrost, virtual keys are the governance entity that ties each request to a team, customer, or project, and that attribution travels with the request into every exporter. Content logging controls decide, per destination, whether prompts and responses leave with it. Regulated teams can review deployment options on the Bifrost Enterprise page.
AI Observability Platforms Compared at a Glance
The nine AI observability platforms below split into a gateway (Bifrost), APM platforms with AI monitoring (Datadog, Dynatrace, New Relic), LLM tracing and evaluation platforms (Arize AI, Langfuse, LangSmith, W&B Weave), and an AI observability platform with guardrails (Fiddler). "Not published" marks a field the vendor's pages, as read for this comparison, did not state.
| Platform | Type | How data arrives | OpenTelemetry | Deployment | Cost and token data |
|---|---|---|---|---|---|
| Bifrost | AI gateway for LLM, MCP, A2A | Captured in the request path, no SDK | Exports OTLP with GenAI conventions | Self-hosted, in-VPC, on-prem, air-gapped | Per request, by virtual key, team, customer, project |
| Datadog LLM Observability | APM platform | SDK, OpenTelemetry, HTTP API | Accepts GenAI conventions | Not published | Token usage, cost dashboards |
| Dynatrace | Full-stack observability | Integrations, OpenInference, OTel | OpenInference or GenAI conventions | Not published | Token consumption, cost metrics |
| New Relic AI Monitoring | APM agent based | APM agent | States parity with OTel AI stacks | Not published | Token counts, model cost comparison |
| Arize AI | Tracing and evaluation | OTLP, OpenInference | Built on OpenTelemetry | Phoenix self-hosted, AX managed | Not published |
| Langfuse | Open source LLM engineering | SDKs, OpenTelemetry | Based on OpenTelemetry | Self-hostable | Cost and tokens per generation |
| LangSmith | Agent tracing and evaluation | SDK, framework integrations | Not published | Cloud, hybrid, self-hosted | Automatic for major providers |
| W&B Weave | Observability and evaluation | Python and TypeScript SDKs, OTLP | OTLP endpoint | Dedicated instances (others not published) | Not published |
| Fiddler AI | AI observability and guardrails | Agent framework integrations | Not published | SaaS, VPC, on-prem, air-gapped | Not published |
Gateway-first comparisons of these tools for day-to-day monitoring are also covered in top AI observability tools for LLM monitoring, and gateway comparisons are collected on the Bifrost alternatives hub.
The Top 9 AI Observability Platforms for Enterprises
Each entry below covers what the platform captures, how it gets the data, and which enterprise team it fits. Bifrost is listed first because it is the capture layer the other eight can receive data from.
1. Bifrost
Bifrost, an enterprise AI gateway, logs, traces, and attributes every LLM request, MCP tool call, and A2A agent operation it handles. Because Bifrost sits in the request path, observability requires a base URL change rather than instrumentation in each service.
- Built-in request logs: built-in observability records inputs, outputs, parameters, tokens, cost, latency, and errors, plus a retry
attempt_trailshowing which keys were tried and why. Logging runs asynchronously, and the logging plugin adds under 0.1 ms in Bifrost's benchmarks. - OpenTelemetry tracing: the OTel connector exports OTLP over HTTP or gRPC using GenAI semantic conventions, groups requests by
session.id, and honors an inbound W3Ctraceparent. - Native connectors: a Datadog connector sends APM traces, LLM Observability spans, and metrics; a Prometheus endpoint supports scraping or Push Gateway.
- Enterprise streams: BigQuery writes one row per request; Kafka and Pub/Sub publish JSON traces.
- SIEM and archives: Splunk receives events and metrics over HEC, and log exports offload payloads to S3, GCS, or Azure Blob Storage as JSON or Parquet.
- Audit and performance: audit logs record administrative changes as HMAC-SHA256 signed events, and Bifrost adds about 11 microseconds of overhead at 5,000 RPS.
Best for: Bifrost is built for enterprises running mission-critical AI workloads that require top-tier performance, scalability, and reliability. It serves as a centralized AI gateway to route, govern, and secure all AI traffic across models and environments with ultra low latency. Bifrost unifies LLM gateway, MCP gateway, and Agents gateway capabilities into a single platform. Designed for regulated industries and strict enterprise requirements, it supports air-gapped deployments, VPC isolation, and on-prem infrastructure. It provides full control over data, access, and execution, along with strong security, policy enforcement, and governance capabilities.
2. Datadog LLM Observability
Datadog LLM Observability, presented as Agent Observability, records each request as a trace with spans for every workflow step and agent decision. Its Python SDK instruments OpenAI, LangChain, AWS Bedrock, and Anthropic calls, capturing latency, errors, and token usage, and dashboards track cost and usage trends. It adds evaluations for quality, privacy, and safety, sensitive data scanning, prompt injection detection, and experiments, and it correlates LLM spans with APM services and RUM sessions. Billing is per LLM span. Bifrost feeds it through the native Datadog connector.
Best for: teams standardized on Datadog APM that want LLM and agent spans next to their service traces.
3. Dynatrace
Dynatrace traces requests across frontend, backend, orchestration, RAG, and LLM layers, and monitors token consumption, latency, availability, and errors per provider. Its AI observability covers agent execution paths, tool invocations, and inter-agent communication, with named integrations for OpenAI, Amazon Bedrock, LangChain and LangGraph, CrewAI, MCP tools, and Google ADK. It ingests OpenInference or OpenTelemetry GenAI conventions, monitors guardrail signals for hallucinations, prompt injection, PII leakage, and toxicity, and tracks GPU and TPU utilization.
Best for: teams already running Dynatrace for full-stack monitoring that need AI workloads in the same topology view.
4. New Relic AI Monitoring
New Relic describes AI monitoring as APM for AI: enabling the APM agent captures token counts, traces of model responses, and errors in prompt and response interactions. Teams can compare cost and performance across models, correlate end-user feedback with responses, and use drop filters to remove sensitive data before it is sent. The AI observability page adds monitoring of the MCP request lifecycle and maps of interactions between agents.
Best for: organizations on New Relic APM that want AI metrics alongside existing golden signals and alerts.
5. Arize AI
Arize offers Phoenix, built on OpenTelemetry and OpenInference instrumentation, and Arize AX, a managed enterprise platform on the same standards. Phoenix accepts traces over OTLP and supports LLM-based, code-based, and human evaluations, datasets and experiments, and versioned prompt management with a playground. Phoenix is free to self-host with Docker or a Helm chart.
Best for: ML and AI engineering teams that need evaluation and experimentation tied to production traces.
6. Langfuse
Langfuse is an open-source, self-hostable AI engineering platform whose tracing is based on OpenTelemetry. Traces capture LLM and non-LLM calls, multi-turn sessions, and agent graphs, with cost and token usage per generation. It adds prompt management with versioning and labels, evaluations (LLM-as-a-judge, code, user feedback, annotation), datasets, and threshold alerts to Slack or webhooks. Bifrost's documented OTel integrations include a Langfuse endpoint.
Best for: teams that want an open-source tracing and prompt workflow they can host themselves.
7. LangSmith
LangSmith records what agents did in production and supports OpenAI, Anthropic, CrewAI, Vercel AI SDK, and Pydantic AI, among other frameworks. It provides dashboards and alerts, annotation queues, online evaluations, and automation rules and webhooks. LangSmith automatically records token usage and cost for major providers from an editable pricing table, and it runs in cloud, hybrid, or self-hosted setups.
Best for: teams building on LangChain and LangGraph that want tracing, evaluation, and prompt iteration in one tool.
8. W&B Weave
W&B Weave is an observability and evaluation platform for agents and LLM applications, with Python and TypeScript libraries. Its OTel-compatible SDK traces sessions, turns, LLM calls, and tool calls in an Agents view, and an OTLP endpoint accepts spans from agents without the Weave SDK. Evaluations use LLM judges and custom scorers.
Best for: teams already using Weights & Biases for model development that want agent traces in the same workspace.
9. Fiddler AI
Fiddler provides agentic observability (application, session, agent, trace, span) with native support for LangGraph, Amazon Bedrock, and AWS Strands Agents, alongside ML observability for drift and performance. Its Centor models run guardrails in the customer's environment to detect hallucinations, toxicity, PII and PHI leakage, and jailbreaks. Fiddler offers SaaS, VPC, on-premises, and air-gapped deployment, and lists SOC 2 Type II and role-based access control.
Best for: teams monitoring both predictive ML models and LLM agents under one governance process.
LLM Tracing at the Gateway Layer with Bifrost
LLM tracing records each model call as a structured span with provider, model, parameters, tokens, cost, and timing. At the gateway layer, the Bifrost gateway produces that span for every request it routes, including requests from services and coding agents that were never instrumented, and attaches governance attribution before the provider is called.
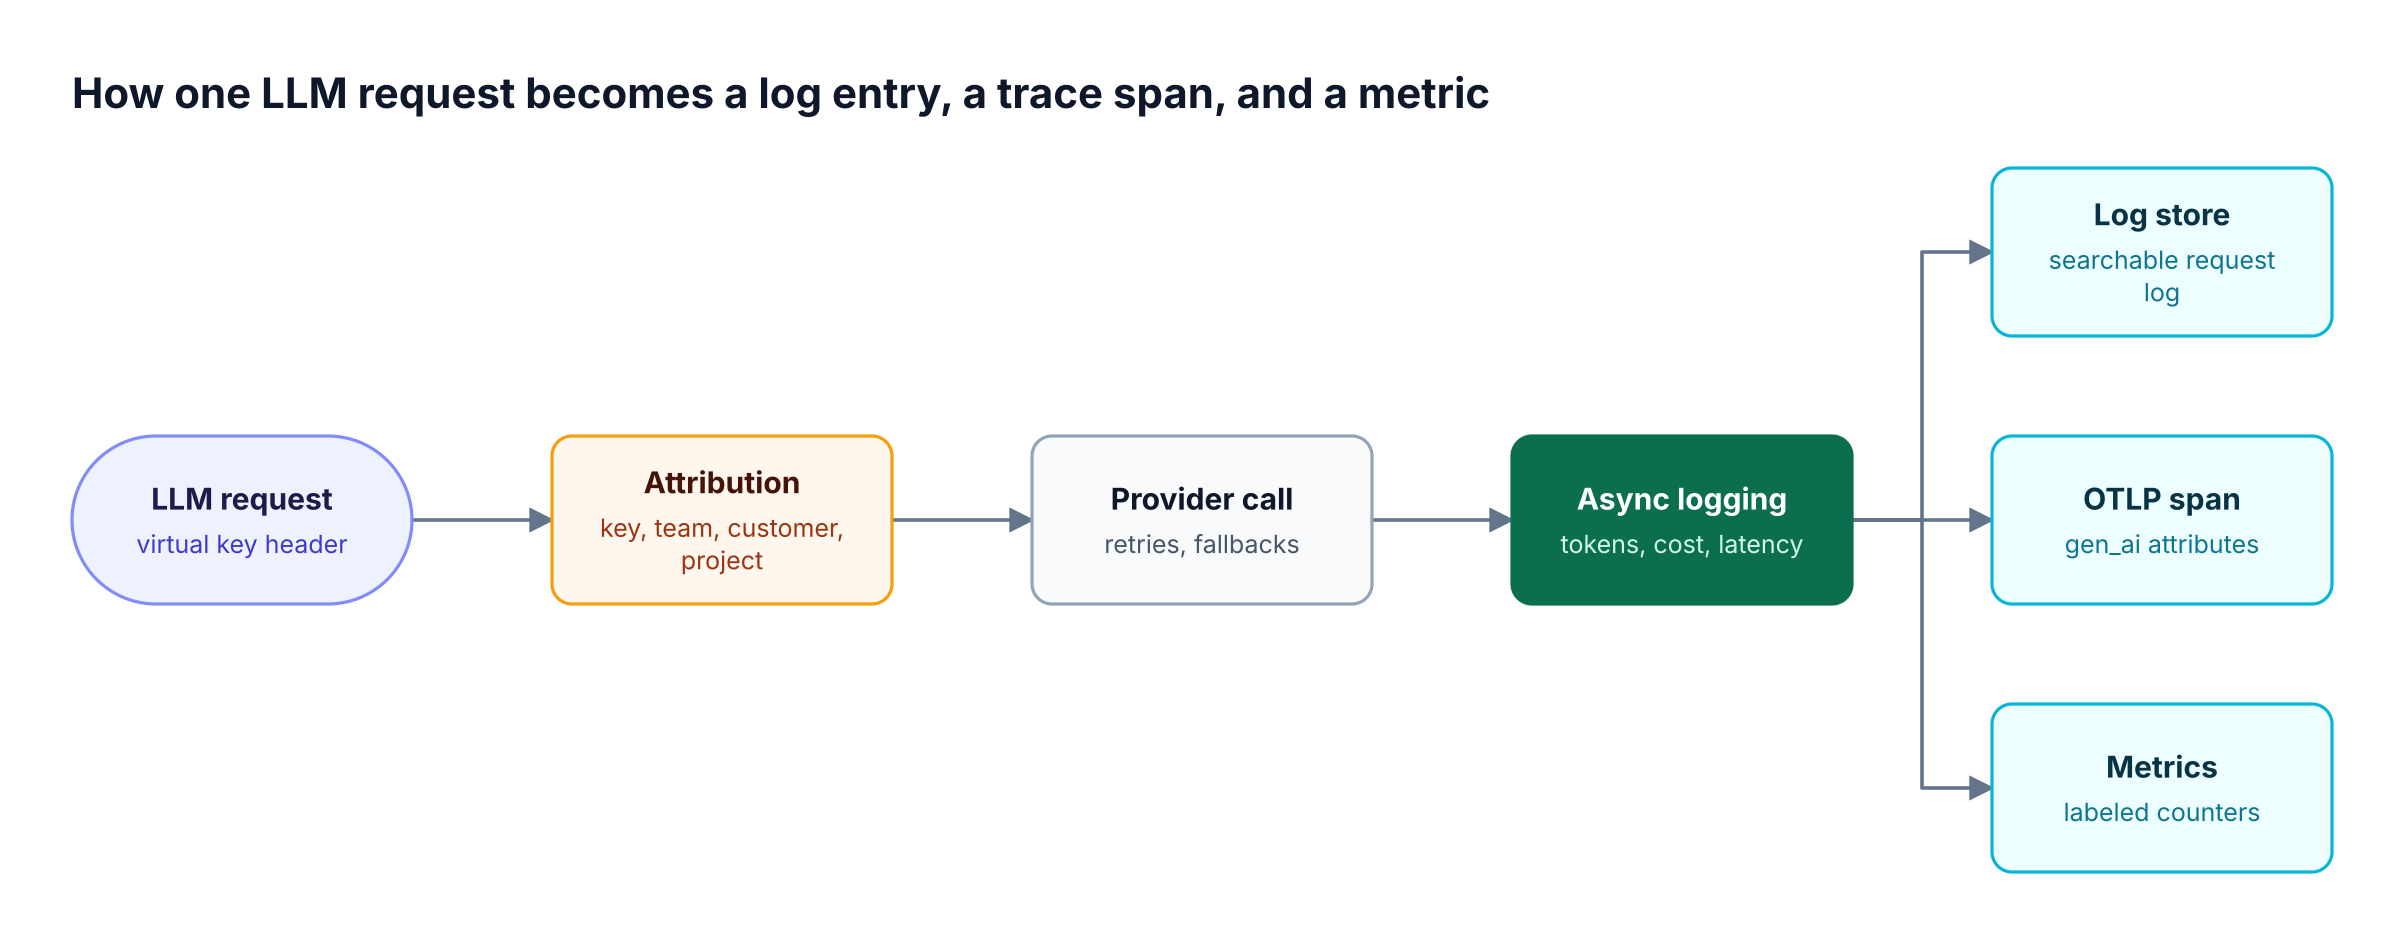
Spans follow the OpenTelemetry GenAI semantic conventions (gen_ai.provider.name, gen_ai.request.model, gen_ai.usage.*), so any OTLP backend can read them. Failed requests carry a normalized bifrost.error.type, including governance refusals that never reached a provider. Streaming requests export two time-to-first-token values: one measured from request receipt and one from the provider stream. Requests arriving on an existing W3C Trace Context stay on that trace, which keeps gateway spans inside the application's distributed trace.
The same pattern is covered from the governance side in AI governance and observability in Bifrost, and the Bifrost LLM logging and tracing guide walks through collector setup end to end.
AI Agent Observability for MCP Tool Calls and A2A Traffic
AI agent observability means following one agent conversation across the agent operation, the model calls it made, and the tools it used. Bifrost governs model, tool, and agent traffic as one gateway, so all three are logged in one place and correlated by session.
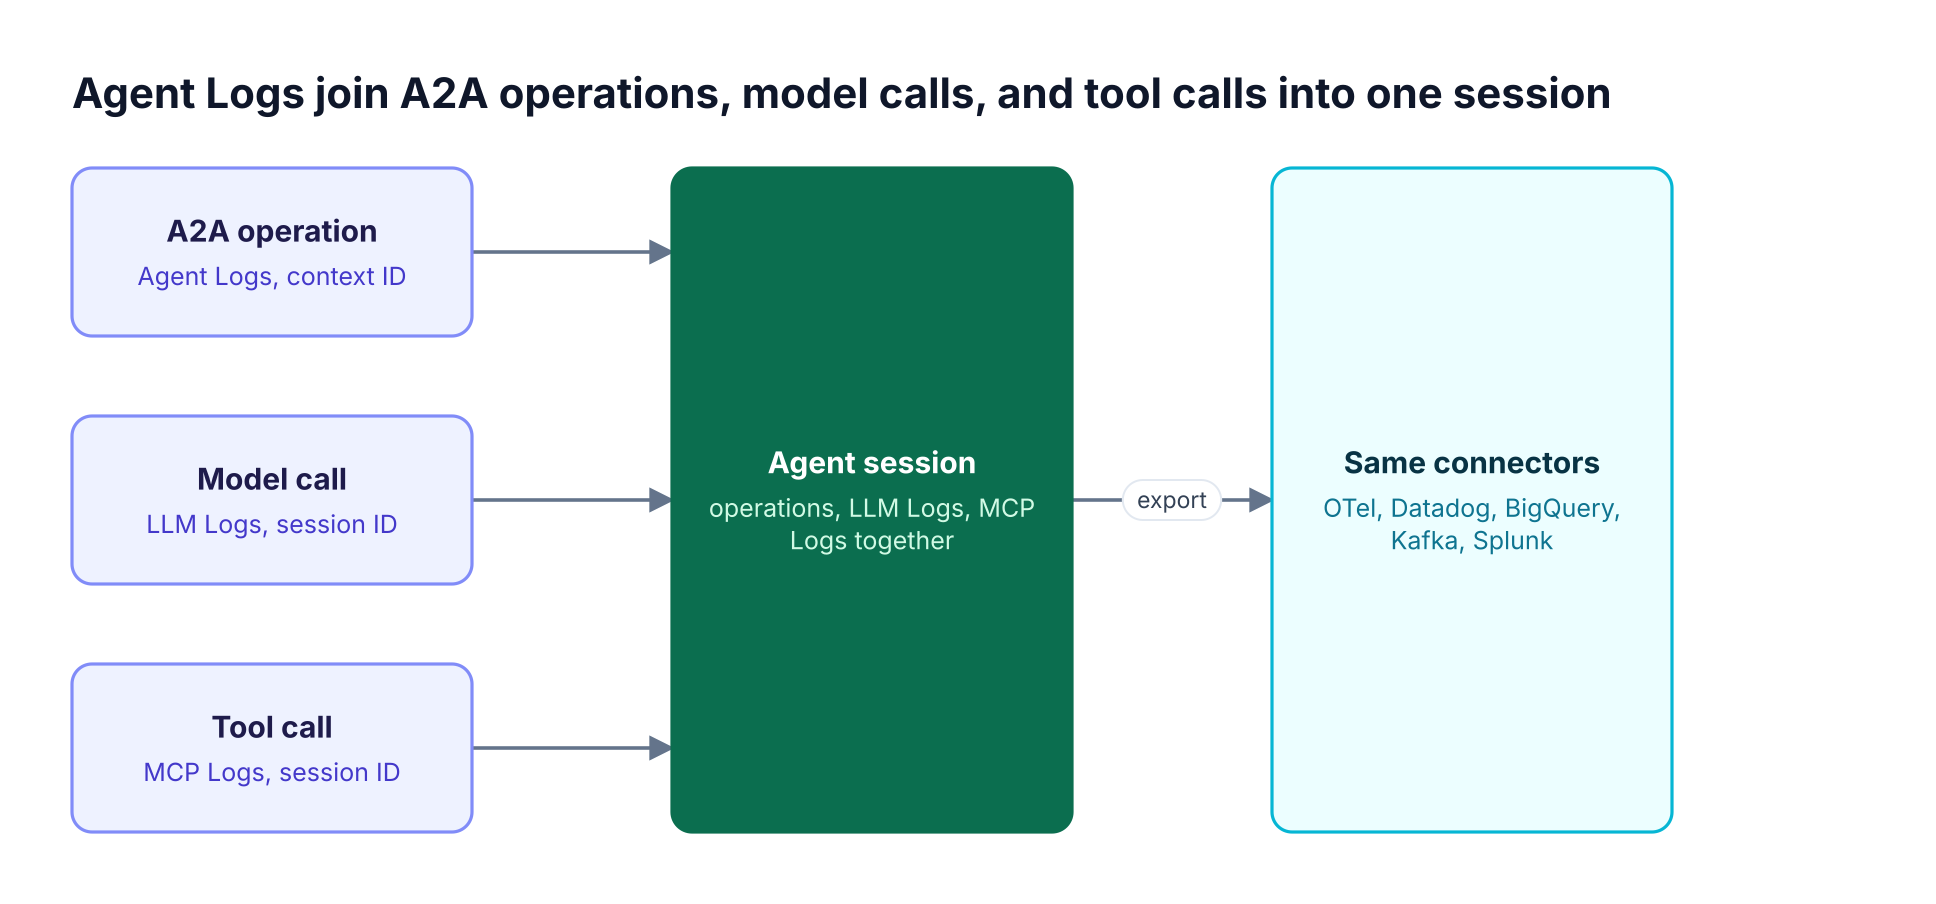
Agent Logs show A2A operations for registered agents, grouped into sessions by the A2A context ID. Each session view lists the operations alongside LLM Logs and MCP Logs whose x-bf-session-id matches, and a task view shows calls carrying that task's correlation ID. A successful A2A response can still contain a failed task, so the returned task state is what tells operators whether the agent's work succeeded. The Agent Gateway exports these operations through the same connectors as LLM traffic, with a2a span attributes described in the agent telemetry export guide.
For tool traffic, Bifrost exports mcp.client.operation.duration per MCP method and tool, dimensioned by virtual key, team, customer, business unit, and project. The Agent Gateway launch post explains the A2A model, and the MCP gateway post on access control and 92% lower token costs covers tool governance and cost.
LLM Monitoring Metrics and Cost Attribution for Platform Teams
LLM monitoring for platform teams depends on metrics that are labeled consistently enough to answer chargeback and incident questions. Bifrost as a central AI gateway emits request, token, cost, latency, cache, and retry metrics with the same attribution labels across Prometheus, OTLP, Datadog, Splunk, and BigQuery, so each destination answers the same question the same way.
| Signal | Example Bifrost metric or field | Attribution available |
|---|---|---|
| Spend | bifrost_cost_total |
Virtual key, team, customer, project |
| Tokens | bifrost_input_tokens_total, cache read and write tokens |
Provider, model, alias, calling app |
| Latency | Upstream latency, time to first token, gateway overhead | Routing engine, selected key, fallback index |
| Reliability | Error requests by status_code, retries per request |
Error type, routing rule |
| Tool calls | mcp.client.operation.duration |
Tool name, MCP method, virtual key |
The Prometheus app label classifies the calling client (for example Claude Code, Cursor, or Codex CLI) from the User-Agent, which separates coding-agent spend from application spend. User-level labels are off by default on Prometheus to limit cardinality and are available in BigQuery columns, Splunk events, and Datadog tags. Budgets and rate limits act on the same attribution, and monitoring LLM costs at the gateway covers the cost side in more detail.
Teams that prefer questions to dashboards can use Warp, the agent for gateway telemetry, which answers questions about logs, spend, and latency from read-only tools; Warp is currently in alpha. Related controls are covered in LLM monitoring metrics, audit logs, and controls.
How to Combine a Gateway with an AI Observability Platform
Enterprises rarely need to pick a single AI observability platform: they can capture once at the gateway and send data to the platforms each team already uses. The deciding questions are whether an APM standard exists, whether teams need evaluations and prompt experiments, and whether security or finance needs raw records in a warehouse or SIEM.
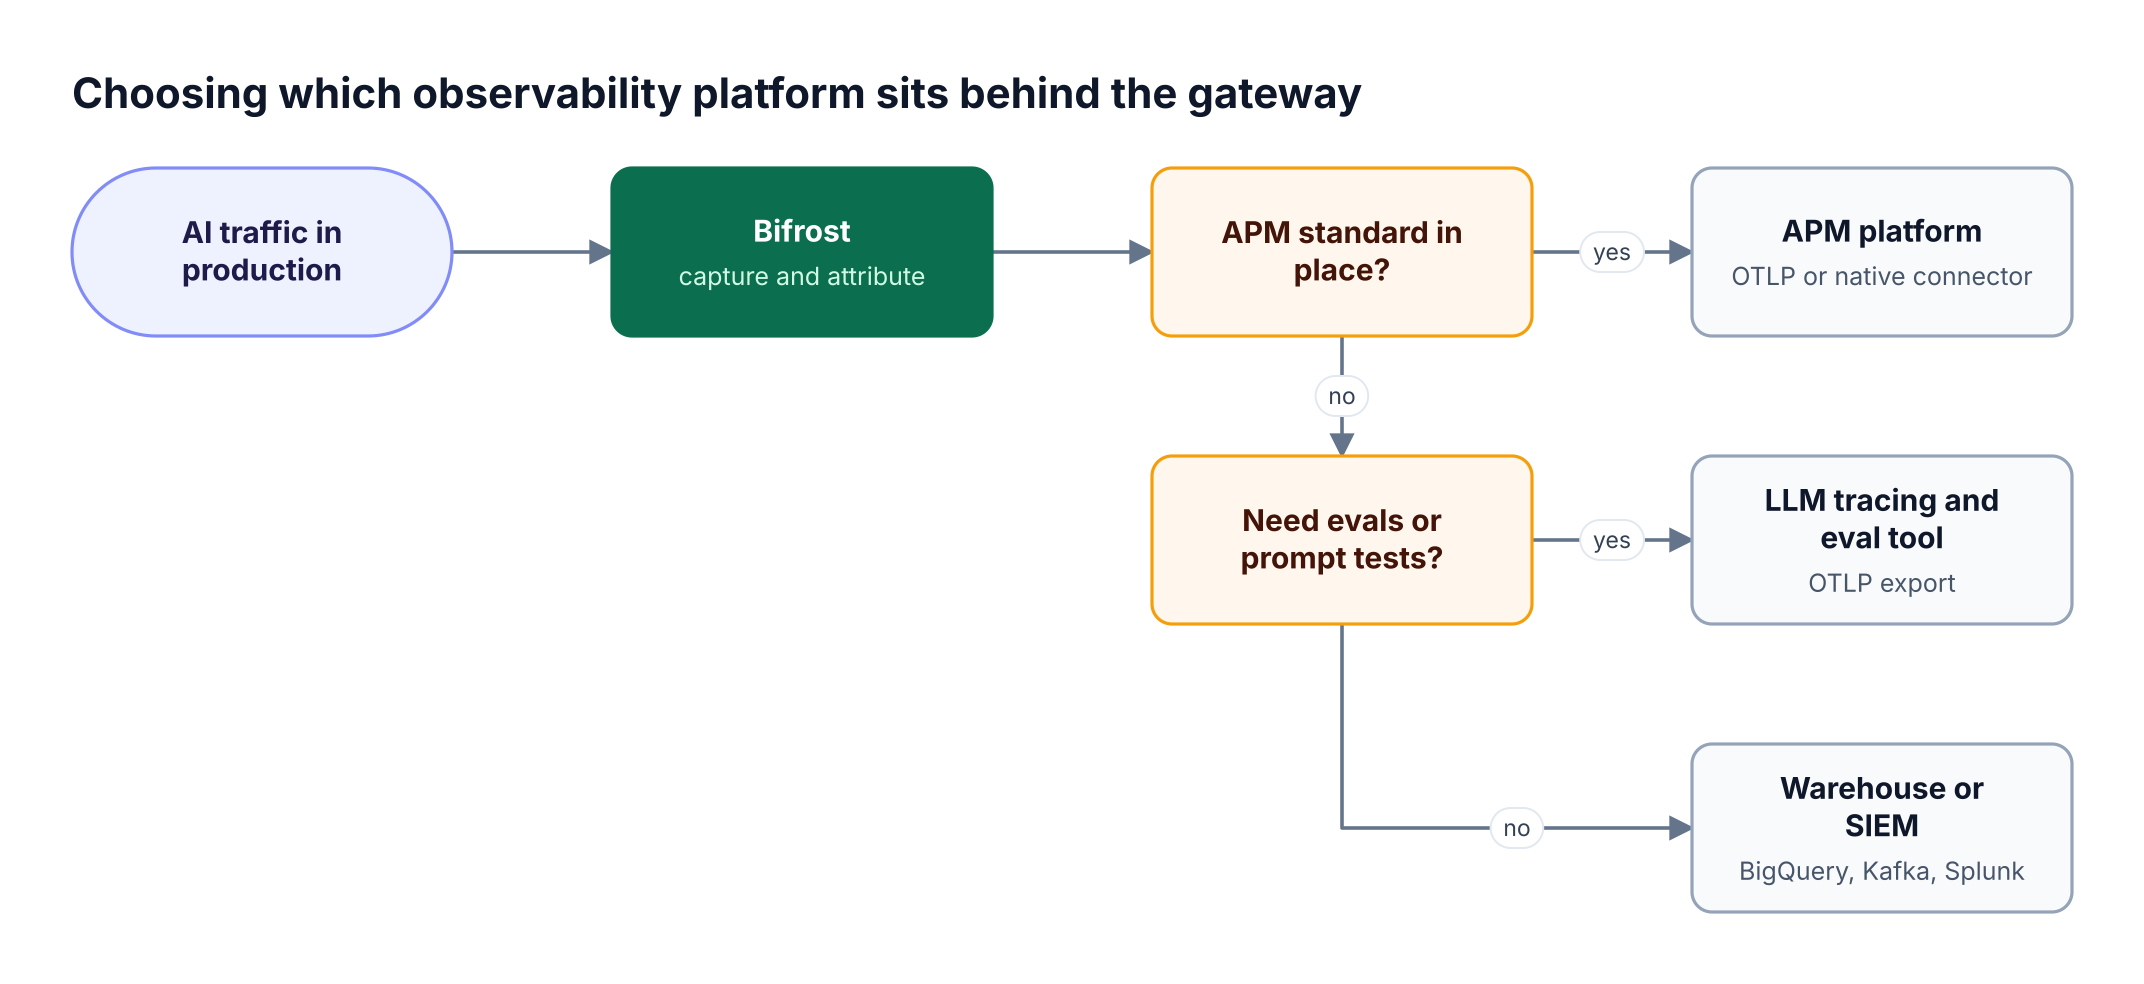
Connectors are configured independently, so one gateway can export OTLP traces to an APM platform or an LLM tracing tool while BigQuery or Splunk receives per-request records for finance and security. Content is stripped per destination, which lets an APM backend receive metadata only while a self-hosted tracing tool keeps full prompts. Signed audit logs and per-request logs together form the AI audit trail for LLM traffic that compliance reviews ask for. The Bifrost AI observability page summarizes these export paths.
Frequently Asked Questions
What is AI observability?
AI observability is the practice of collecting and analyzing telemetry from AI systems in production, including prompts, responses, token usage, cost, latency, errors, tool calls, and agent operations. It extends traditional observability with AI-specific signals such as token cost and model quality, so teams can debug failures, control spend, and audit how AI systems behaved. Bifrost provides it at the gateway layer and exports it to existing backends.
What is LLM observability?
LLM observability is the subset of AI observability focused on model calls: each request is logged with its provider, model, parameters, input and output messages, token counts, cost, latency, and status. Platforms add tracing, search, dashboards, and alerting on top. In Bifrost, every LLM request routed through the gateway is logged automatically and can be exported as an OpenTelemetry span with GenAI attributes.
What is AI agent observability?
AI agent observability tracks an agent's work across steps: the request it received, the models it called, the tools it used, and the final task state. Because failures often start in a tool call, it requires correlation across operations. Bifrost groups A2A operations, LLM Logs, and MCP Logs into one session using the A2A context ID and the x-bf-session-id header.
Do AI observability platforms support OpenTelemetry?
Many do. Datadog accepts OpenTelemetry GenAI semantic conventions, Dynatrace ingests OpenInference or GenAI conventions, Arize Phoenix and Langfuse are built on OpenTelemetry, and W&B Weave exposes an OTLP endpoint. Bifrost exports OTLP traces and metrics over HTTP or gRPC, so the same gateway telemetry can reach any of these backends without re-instrumenting applications.
Can an AI gateway replace an AI observability platform?
An AI gateway covers capture, attribution, request logs, and metrics, and Bifrost includes a built-in log viewer with real-time streaming, filtering, and token and cost analytics. Teams that need evaluations, prompt experiments, or correlation with non-AI services usually keep a dedicated platform as well. The common pattern is to capture at the gateway and export to one or more AI observability platforms, as described on the Bifrost governance resource page.
How do AI observability platforms track LLM cost?
Most compute cost from token counts and a model price table, either from SDK data or from spans. Bifrost calculates cost per request at the gateway and attaches it to logs, spans, and the bifrost_cost_total metric, labeled by virtual key, team, customer, and project. That makes chargeback a standard query in Prometheus, Datadog, Splunk, or BigQuery.
Try Bifrost for Gateway-Layer AI Observability
AI observability platforms work best when every AI request reaches them with consistent attribution, whether it came from an application, a coding agent, or another agent. Bifrost captures LLM, MCP, and A2A traffic in one self-hosted gateway, attributes it to keys, teams, and customers, and exports it to the AI observability platforms on this list over OpenTelemetry and native connectors, inside your own infrastructure. To see it on your traffic, book a demo with the Bifrost team.