Top AI Observability Tools for LLM Monitoring in 2026
Compare the top AI observability tools for LLM monitoring in 2026 on latency and error SLOs, cost alerts, failover visibility, and on-call alert routing.

TL;DR
- AI observability tools for production LLM monitoring should measure latency, time to first token, fault-classified errors, token usage, and cost per team, then route alerts to on-call channels.
- Bifrost monitors at the gateway layer: it records every model call, exports Prometheus, OpenTelemetry, Datadog, Splunk, BigQuery, and Kafka telemetry, and adds 11 microseconds of overhead per request at 5,000 RPS.
- Datadog LLM Observability and Splunk AI Agent Monitoring extend existing APM platforms with LLM spans, while Arize AX and Galileo pair tracing with evaluation-driven quality monitoring.
- Most enterprise platform teams combine a gateway for traffic-level signals and budget alerts with one APM or evaluation backend for application-level traces.
AI observability tools give platform and SRE teams the latency, error, token, and cost data they need to run LLM applications against production service level objectives. Bifrost, the open-source AI gateway built by Maxim AI, is the best choice for enterprises running mission-critical AI workloads that require best-in-class performance, scalability, and reliability, because it measures every model call at the point where traffic leaves the organization. This guide compares five AI observability tools through an operations lens: SLO signals, alerting, budget controls, incident response, and visibility into multi-provider failover.
What Is AI Observability in Production?
AI observability is the practice of collecting traces, metrics, and logs from AI systems so teams can explain their behavior, cost, and failures in production. For LLM applications, that means each model call's latency, tokens, cost, and error cause, plus the prompts, tool calls, and agent steps that produced the call in the first place.
LLM monitoring is the operational subset: the dashboards, SLOs, and alerts that tell on-call engineers something is wrong now. Evaluation platforms answer "is the answer good?", while monitoring answers "is the service up, fast, and within budget?"
Production LLM telemetry comes from two capture points. Application SDKs see the prompt, the retrieval context, and the agent's reasoning steps. An AI gateway sees every request that reaches a model provider, regardless of which team, language, or framework sent it. Figure 1 shows how the two feed the same on-call path.
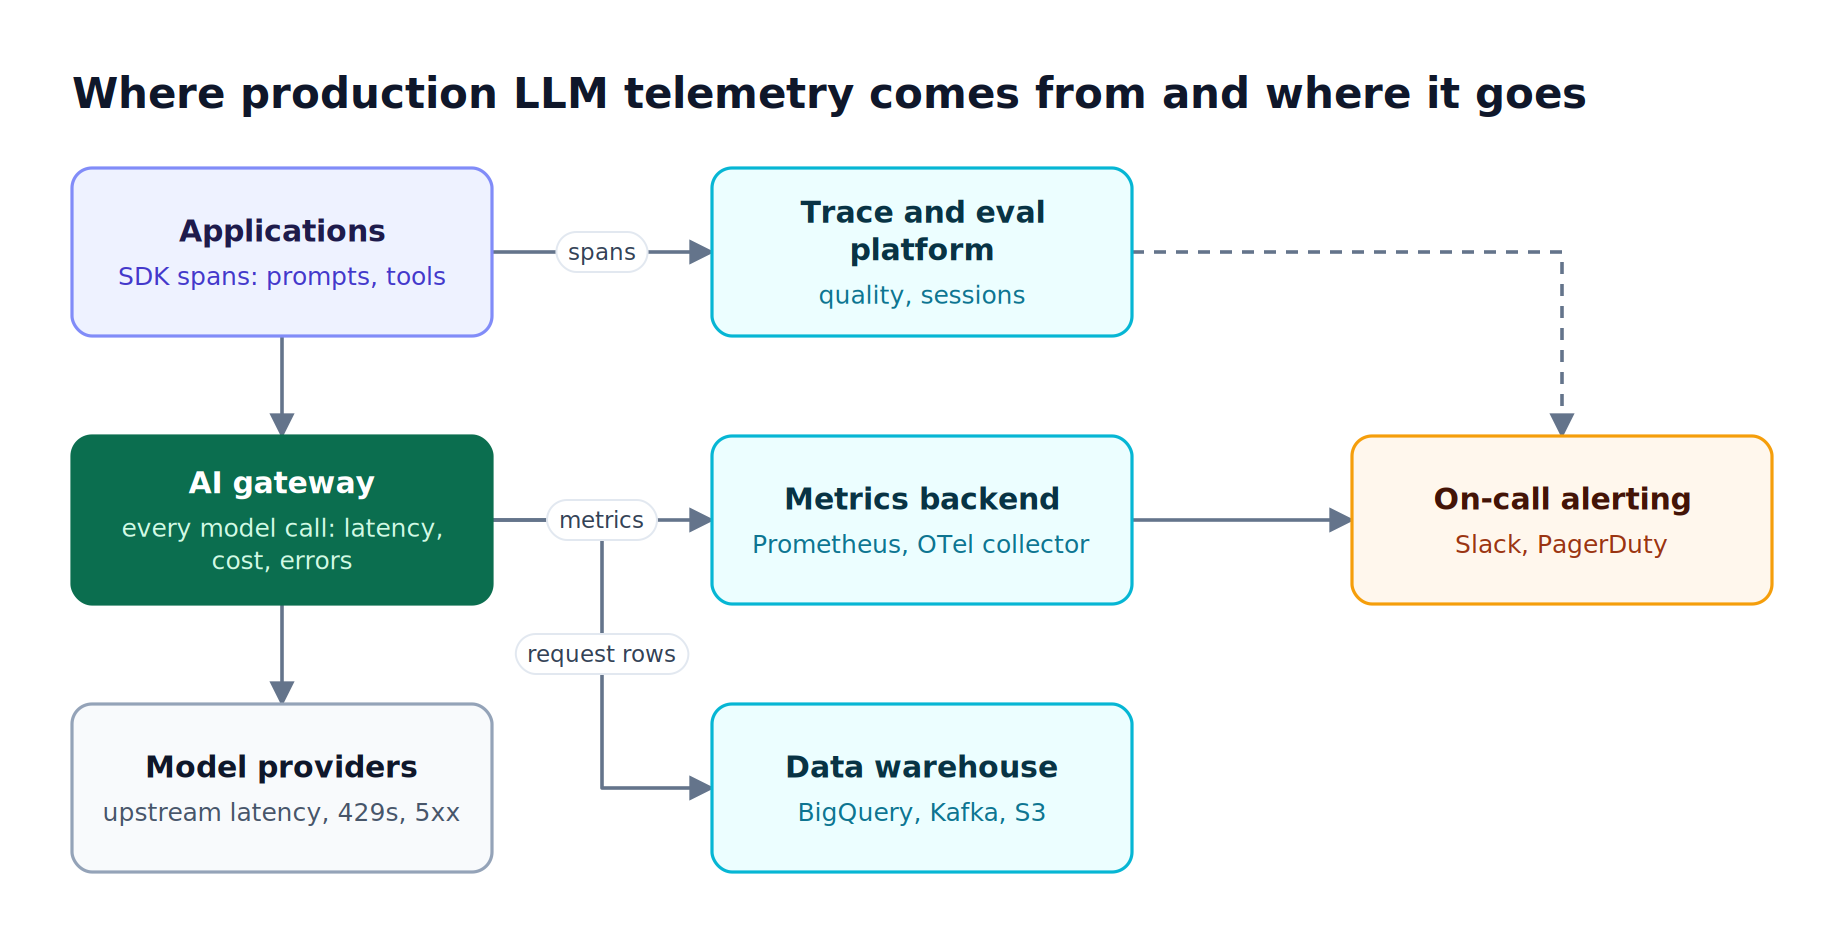
Figure 1: Application SDKs see prompts and agent steps; the gateway sees every model call, so a production stack needs both feeding the same on-call path.
Cost and control have made this an SRE concern. A Gartner forecast predicts that over 40% of agentic AI projects will be canceled by the end of 2027 due to escalating costs, unclear business value, or inadequate risk controls. For the wider category, see our roundup of observability tools for monitoring AI systems and our guide to observability tools that track all AI traffic.
Key Criteria for Evaluating AI Monitoring Tools
The best AI monitoring tools for platform teams measure SLO signals at request granularity, classify errors by who caused them, attribute cost to teams, and deliver alerts to the channels on-call engineers already use. They also fit the existing telemetry stack and keep prompt data under the organization's control.
| Criterion | What to check | Why it matters to SRE teams |
|---|---|---|
| SLO signals | p50/p95 latency, time to first token, error rate per provider and model | Latency and availability SLOs need histograms, not averages |
| Error classification | Can a 429 from your own limit be told apart from a provider 429? | Paging the wrong team extends every incident |
| Attribution | Labels for team, customer, application, and API key | Cost and error budgets are owned per team |
| Alerting | Threshold types, channels (Slack, PagerDuty, webhooks), cooldowns | Alerts that never reach on-call are dashboards |
| Budget controls | Spend thresholds that notify, and limits that enforce | Cost incidents look like traffic incidents until someone checks the bill |
| Failover visibility | Retries, key rotations, and fallback hops recorded per request | A fallback hides an outage from users but not from the budget |
| Stack fit | OpenTelemetry, Prometheus, APM, and warehouse export | Correlation with the rest of production telemetry |
| Data control | Self-hosting, metadata-only logging, redaction | Prompts often contain regulated data |
The Google SRE book defines an SLI as "a carefully defined quantitative measure of some aspect of the level of service that is provided" and an SLO as a target value for that measure. LLM services need the same discipline, with two additions: cost is a first-class SLI, and failures come from several fault domains (caller, policy, provider, and the gateway itself). Our breakdown of LLM monitoring metrics, audit logs, and controls covers the control side in more depth.
LLM Metrics That Belong in an SLO
An LLM SLO should track availability excluding caller mistakes, upstream latency as a histogram, time to first token for streaming, cost per team, and resilience events such as retries and fallbacks. These signals are most reliable when captured at the gateway, because every provider call passes through it with the same labels and error vocabulary.
| SLI | What it measures | Example gateway metric (Bifrost) |
|---|---|---|
| Availability | Failed requests over total, excluding caller errors | bifrost_error_requests_total with error_type!~"caller_.*" |
| Latency | Provider response time distribution | bifrost_upstream_latency_seconds |
| Streaming responsiveness | Time to first token and inter-token gaps | bifrost_stream_first_token_latency_seconds |
| Cost | USD spend by team, customer, or virtual key | bifrost_cost_total |
| Resilience | Retries per request and API key rotations | bifrost_request_retries, bifrost_key_rotation_events_total |
| Key health | Whether each provider key is currently succeeding | bifrost_provider_key_up |
| Gateway overhead | Time spent in the gateway itself | bifrost_overhead_latency_microseconds |
Every metric in that list is exposed on Bifrost's Prometheus endpoint, and request-level metrics carry labels for provider, model, virtual key, team, customer, and fallback position. The fallback position is the label that explains otherwise invisible degradation. When a primary provider starts returning 429s, automatic retries and fallbacks keep users served, which means the user-facing error rate stays flat while cost, latency, and the provider's health all change. Figure 2 shows where each of those signals is recorded.
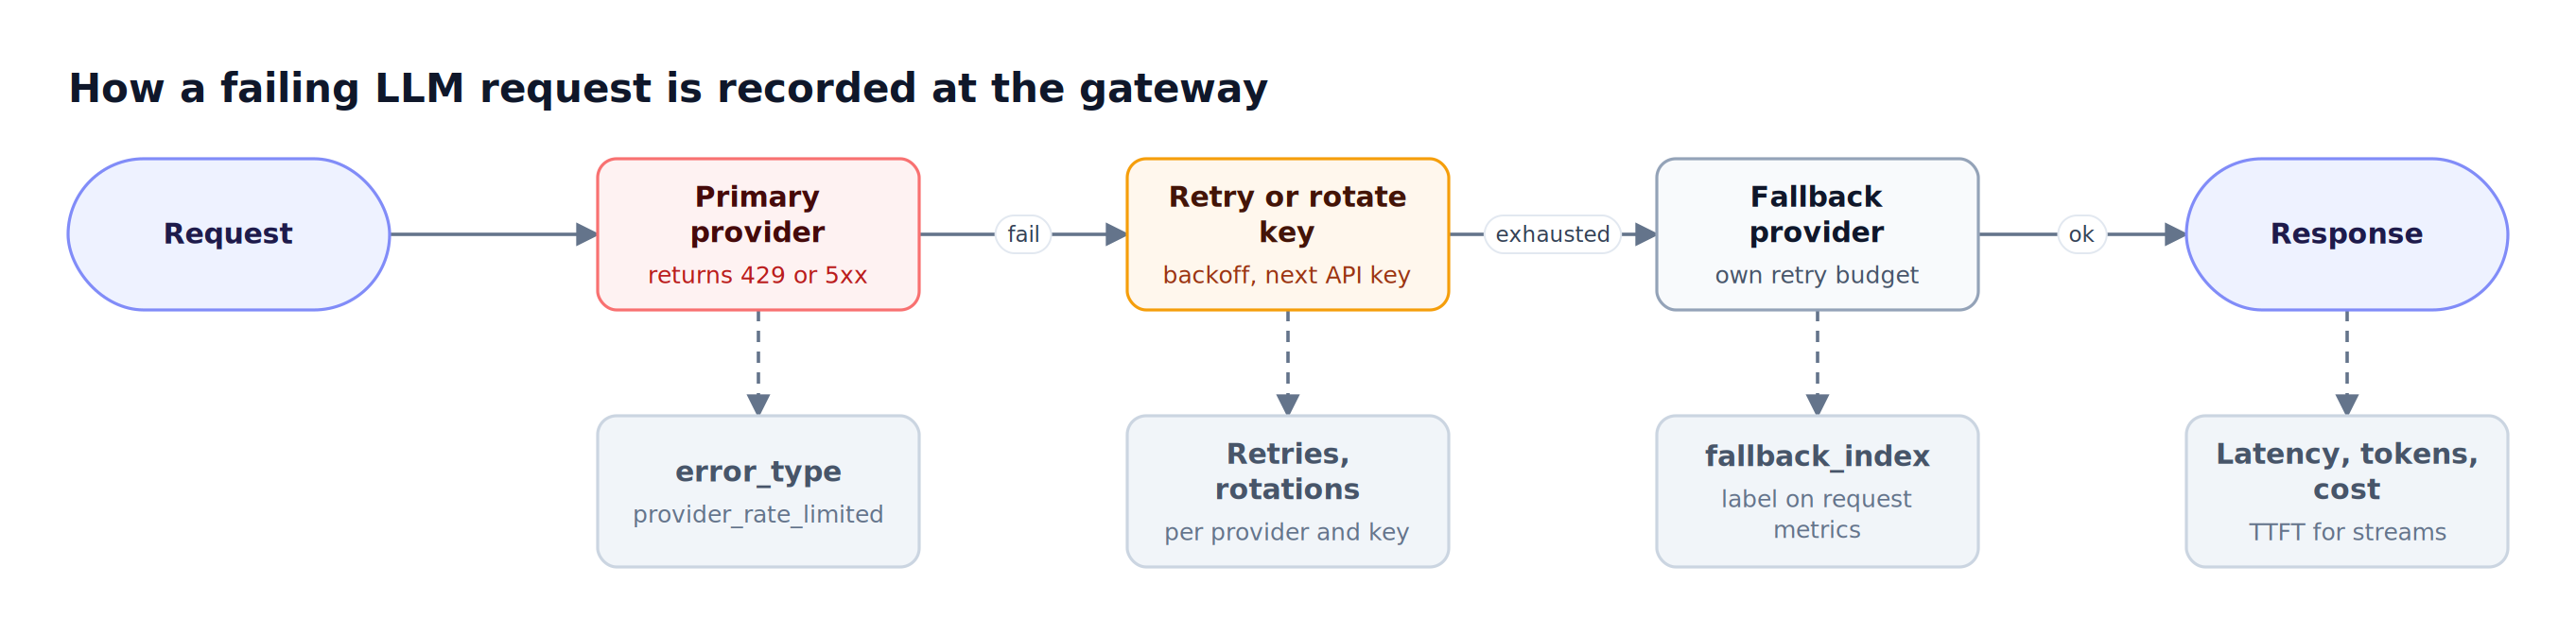
Figure 2: Each resilience step leaves a separate metric, so a dashboard can show degradation that users never saw as an error.
For trace-based backends, the OpenTelemetry GenAI semantic conventions define shared spans, metrics, and events for model calls, which is what lets gateway spans and application spans line up in one trace view.
AI Observability Tools Compared at a Glance
The five AI observability tools below fall into three types: a gateway that measures all model traffic (Bifrost), APM platforms that add LLM spans to service monitoring (Datadog, Splunk), and trace-plus-evaluation platforms focused on output quality (Arize AX, Galileo). "Not published" means the vendor pages reviewed did not state it.
| Tool | Capture point | Alerting | Cost tracking | Failover visibility | Deployment |
|---|---|---|---|---|---|
| Bifrost | AI gateway, every model call, no SDK changes | Budget and rate-limit rules to Slack, Teams, PagerDuty, webhooks; metrics for SLO alerts in Prometheus or OTel | Per request, rolled up by virtual key, team, customer | Retries, key rotations, fallback index, per-key health | Self-hosted, in-VPC, clustered |
| Datadog LLM Observability | SDKs, OTel GenAI conventions, HTTP API | Datadog monitors on latency, cost, quality | Cost next to latency and quality | Retries and errors per step | SaaS |
| Arize AX | OpenInference and OpenTelemetry traces | Monitors on any span attribute; Slack, PagerDuty, OpsGenie, Teams, email, webhooks | Costs recorded per run in traces | Not published | SaaS or self-hosted |
| Galileo | Logged traces with evaluators | Alerts on status code, cost, latency, eval metrics; email, Slack, webhooks | Cost as a default alert metric | Not published | SaaS, VPC, on-premises |
| Splunk AI Agent Monitoring | OpenTelemetry into Splunk APM | Alerts on any tracked metric | Tokens and their cost | Not published | Splunk Observability Cloud |
A cost-focused view of the same category is in our comparison of an AI observability platform for monitoring LLM costs, and a data-control view is in our list of LLM observability tools for enterprises.
1. Bifrost
Bifrost is an open-source AI gateway that sits between applications and model providers, so it observes every LLM request without per-service instrumentation. It routes to 25+ providers and 10,000+ models through one OpenAI-compatible API and exports the resulting telemetry to the monitoring tools a platform team already runs.
Best for: Bifrost is built for enterprises running mission-critical AI workloads that require best-in-class performance, scalability, and reliability. It serves as a centralized AI gateway to route, govern, and secure all AI traffic across models and environments with ultra low latency. Bifrost unifies LLM gateway, MCP gateway, and Agents gateway capabilities into a single platform. Designed for regulated industries and strict enterprise requirements, it supports air-gapped deployments, VPC isolation, and on-prem infrastructure. It provides full control over data, access, and execution, along with robust security, policy enforcement, and governance capabilities.
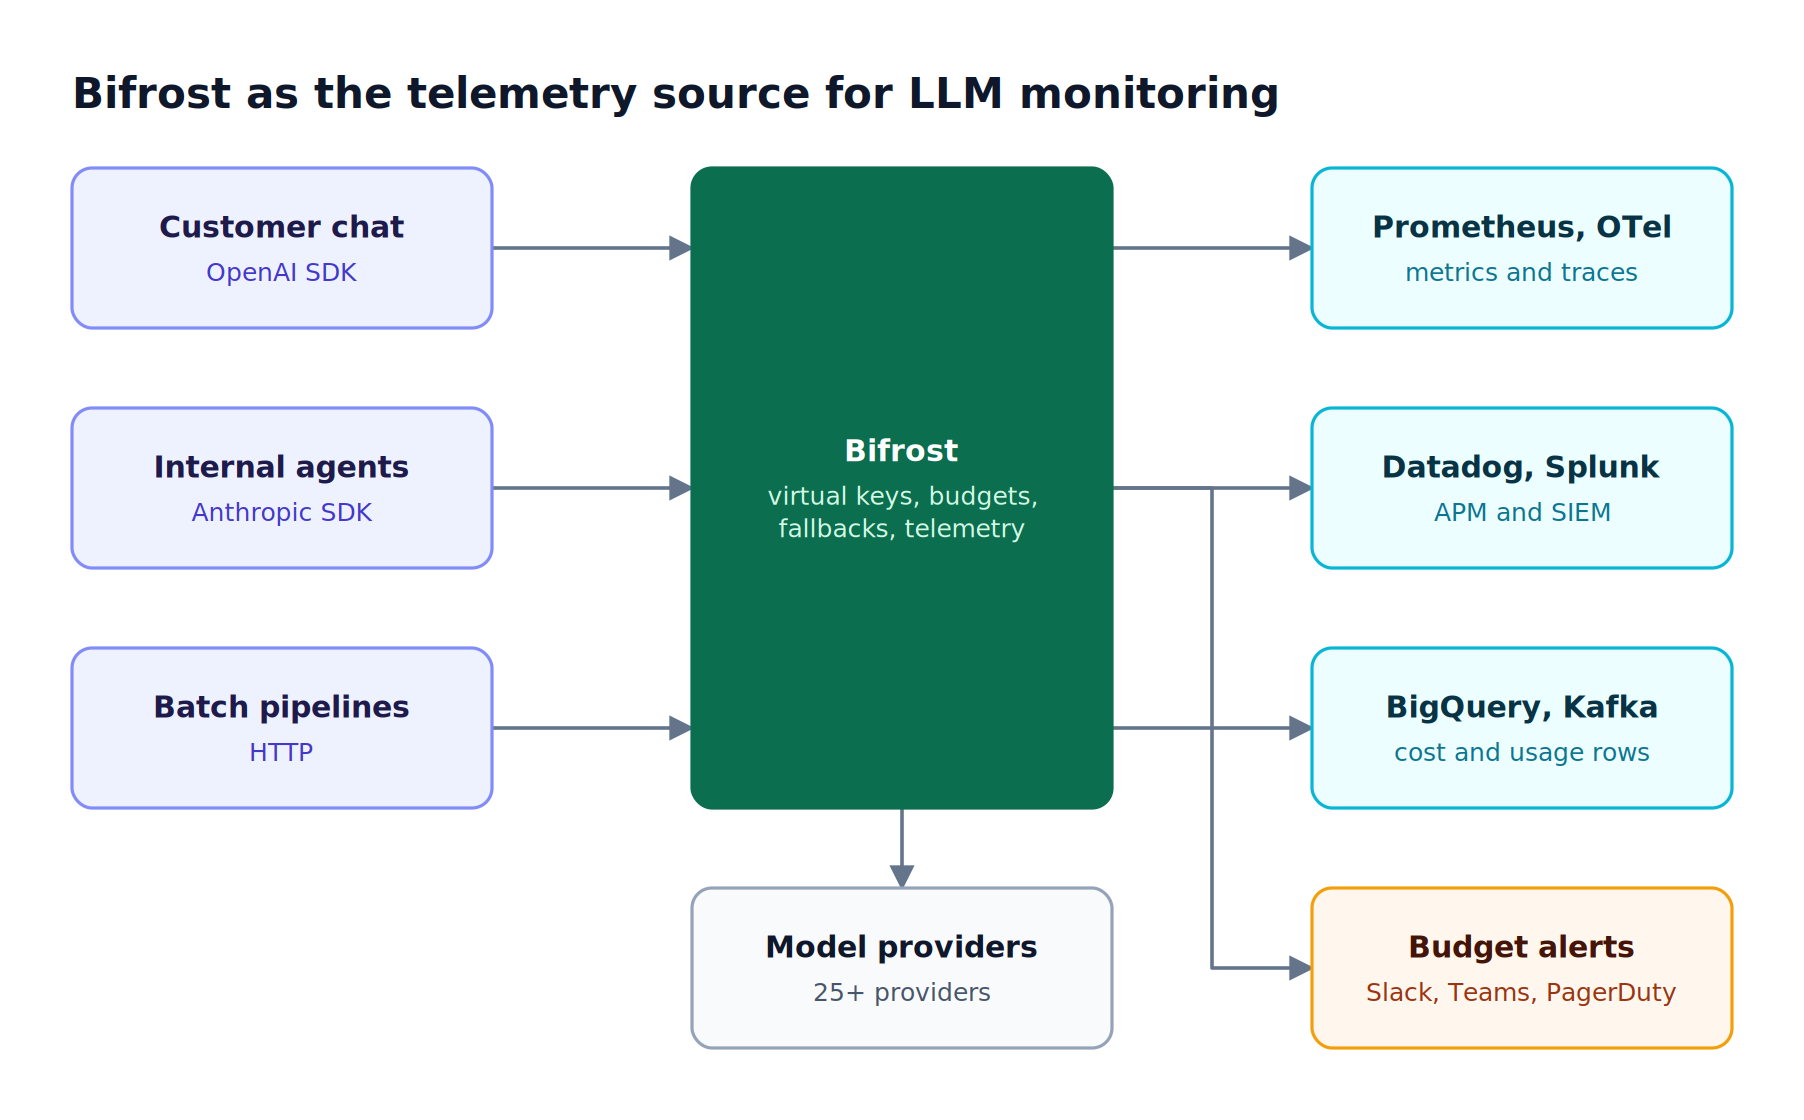
Figure 3: One gateway deployment feeds the monitoring tools a platform team already runs, instead of adding a new SDK to every service.
As Figure 3 shows, Bifrost is the telemetry source rather than another destination. Capabilities that matter to SRE teams:
- Request logging: built-in observability captures inputs, outputs, tokens, cost, latency, and status for every request asynchronously, with under 0.1 ms of overhead. An
attempt_trailfield lists every key tried on a retried request. - Latency attribution: each log splits total latency into upstream time and gateway overhead, with a per-component overhead breakdown, so "is it us or the provider?" has a direct answer.
- Metrics and traces: a Prometheus
/metricsendpoint, Push Gateway support for multi-node clusters, and an OpenTelemetry connector that emits traces in the GenAI semantic convention format and pushes OTLP metrics. - Enterprise connectors: native exports to Datadog (APM traces, LLM Observability, and metrics), Splunk over HTTP Event Collector, BigQuery as one row per request, Kafka, and Pub/Sub.
- Budget and rate-limit alerts: Enterprise alerting evaluates CEL rules such as
budget_usage_percent >= 80.0against virtual keys, teams, or customers every 60 seconds, with per-rule and per-channel cooldowns to prevent alert storms. - Enforcement, not only visibility: hierarchical budgets and rate limits at the virtual key, team, customer, and provider level stop spend at the limit, and the refusal shows up as
policy_budget_exceededin metrics. - Adaptive routing: adaptive load balancing recomputes key and provider weights every 5 seconds from error rate, latency, and utilization.
For data control, Bifrost runs in your own infrastructure with in-VPC deployments, can log usage metadata without prompt content, and stores redacted content when guardrail redaction is enabled. Administrative changes land in audit logs that can be HMAC-signed, the record an incident review needs when a routing rule or budget changed before an outage.
Bifrost's published benchmarks show 11 microseconds of overhead per request at 5,000 RPS with a 100% success rate, so the monitoring layer does not become a latency source itself. The Bifrost governance model explains how virtual keys map to teams and budgets.
2. Datadog LLM Observability
Datadog LLM Observability adds LLM tracing to the Datadog platform, so model calls appear next to APM services, infrastructure metrics, and real user monitoring sessions. It suits organizations whose on-call process already runs on Datadog monitors.
Best for: teams standardized on Datadog APM who want LLM spans correlated with the rest of their service telemetry.
Capabilities stated on Datadog's product page and documentation:
- End-to-end traces of prompts, retrieval steps, tool calls, and agent decisions, with latency, token usage, retries, and errors at each step.
- Monitors for latency, cost, and quality issues, plus built-in and custom evaluators.
- Sensitive Data Scanner to scan and redact sensitive data and identify prompt injections.
- Native support for the OpenTelemetry GenAI semantic conventions, with SDKs for Python, Node.js, and Java.
Considerations: billing is metered on LLM spans ingested, and standard retention is 15 days. Teams can send gateway-level data into the same account with the Bifrost Datadog connector, which supports both agent and agentless modes.
3. Arize AX
Arize AX is an agent observability and evaluation platform built on the OpenInference and OpenTelemetry standards. For production monitoring, it lets teams set monitors on any trace attribute, including latency, status, token counts, and evaluation labels, with automatic thresholds learned from historical data or fixed static thresholds.
Best for: ML and AI engineering teams that want quality monitoring and evaluations tied directly to production traces.
Capabilities stated in Arize's product pages and documentation:
- Tracing from the team that created OpenInference, with span, trace, and session evaluations at scale.
- Monitors on span attributes or custom metrics, with automatic or static thresholds and upper and lower bounds.
- Alert delivery to email, Slack, PagerDuty, OpsGenie, Microsoft Teams, and HTTP webhooks.
- SaaS and self-hosted deployment, with Arize Phoenix available as an open-source option.
Considerations: Arize AX monitors what instrumentation emits, so provider-level events such as key rotations need an upstream layer to record them. Bifrost's OpenTelemetry trace export ships GenAI semantic convention spans today and lists the OpenInference format as coming soon.
4. Galileo
Galileo combines AI observability with a library of evaluators and runtime controls. Its alerting covers status code, cost, latency, and custom evaluation metrics such as correctness, aggregated over a chosen time window and delivered by email, Slack, or webhook.
Best for: teams that want evaluation scores, including low-cost evaluator models, to drive both alerts and runtime decisions.
Capabilities stated on Galileo's site and documentation:
- More than 20 prebuilt evaluators for RAG, agents, safety, and security, plus custom evaluators.
- Luna-2 evaluator models distilled for lower latency and cost, and Protect, which uses evaluation scores to control agent actions and tool access.
- Alerts built from a metric, an aggregation (average, minimum, maximum, count, or sum), a threshold, and a time window.
- SaaS, virtual private cloud, and on-premises deployment.
Considerations: Galileo's controls act on evaluation results inside the application flow. Teams that need enforcement on every model call can add gateway guardrails in front of all traffic.
5. Splunk AI Agent Monitoring
Splunk AI Agent Monitoring extends Splunk Observability Cloud and Splunk APM to LLM services and AI agents. It tracks total requests, errors and error rate, latency, input and output tokens with their cost, a quality score, and risks, and teams can set alerts on any of those metrics alongside prebuilt dashboards.
Best for: organizations that already run incident response on Splunk and want AI services in the same service map and alerting workflow.
Capabilities stated in Splunk's documentation and announcements:
- LLM services shown as AI services in the APM service map, with an AI Interactions tab that filters spans by
gen_ai.operation.name. - LLM-as-a-judge evaluators that flag hallucinations, bias, sentiment, and toxicity by trace ID.
- Instrumentation built on OpenTelemetry, with prompt and response capture turned off by default.
Considerations: Splunk has two ingestion paths for gateway data. The Bifrost Splunk connector sends flattened per-request events and metrics to Splunk Enterprise or Splunk Cloud over HTTP Event Collector, while trace spans for Splunk Observability Cloud go through the OpenTelemetry connector and a collector.
How to Build an LLM Monitoring Stack for SRE Teams
An effective LLM monitoring stack routes all model traffic through one gateway, exports its metrics to the existing backend, defines SLO alerts that exclude caller errors, adds budget alerts per team, and uses fault-classified errors to page the right owner. Tracing and evaluation tools then add depth for quality issues.
A practical rollout for a platform team:
- Put every model call behind the gateway. Issue one virtual key per team or application, so every metric carries a team and key label. Headers prefixed with
x-bf-lh-are copied into log metadata for tenant or environment tags. - Export metrics. Scrape
/metricsfor a single node, or use Push Gateway or OTLP metrics push for clusters behind a load balancer. Our guide to OpenTelemetry traces and metrics for LLMs walks through collector setup. - Alert on the right error rate. Exclude caller mistakes from availability alerts so a client bug does not page the platform team:
sum(rate(bifrost_error_requests_total{error_type!~"caller_.*"}[5m]))
  / sum(rate(bifrost_upstream_requests_total[5m]))
- Add budget alerts. Configure rules at 80% and 100% of each team's budget, sent to Slack for awareness and PagerDuty for exhaustion. Our walkthrough on controlling LLM costs with budget alerts and rate limits covers threshold design.
- Triage by fault domain. Route alerts using the
error_typeprefix, as Figure 4 shows.
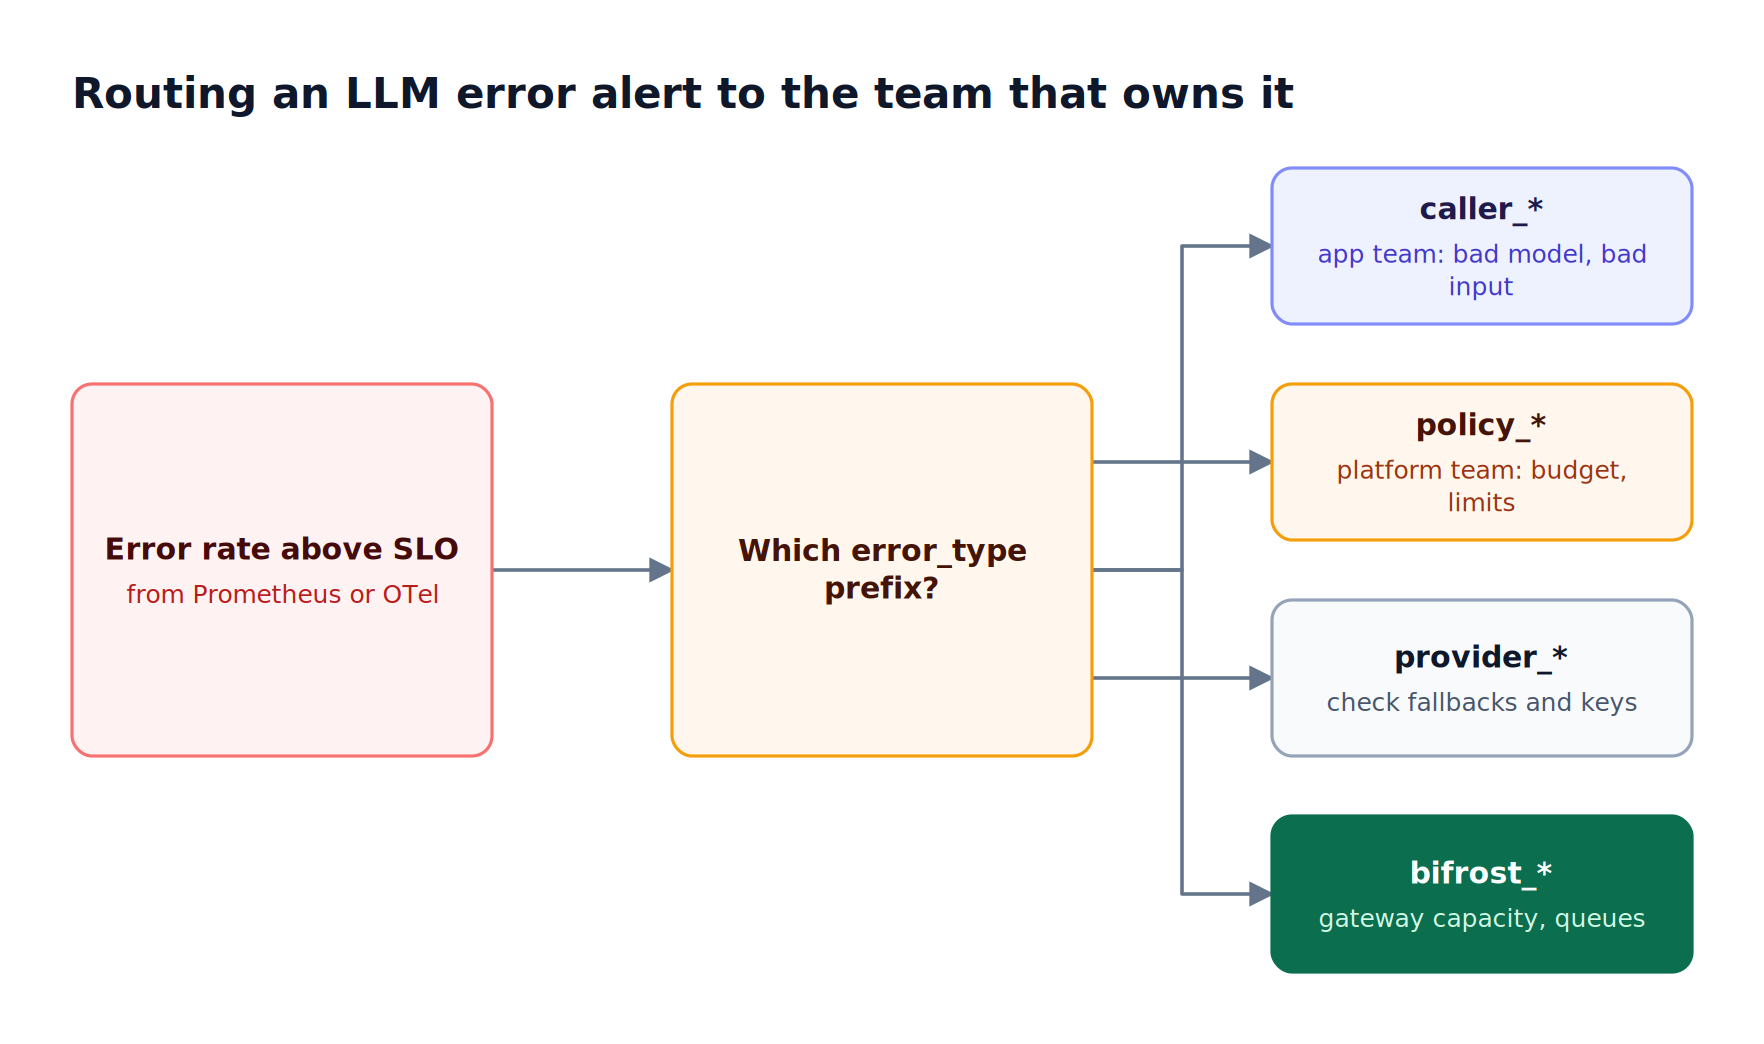
Figure 4: Classifying failures by fault domain at the gateway turns one noisy error-rate page into four actionable ones.
The same status code means different things by domain. A 429 is policy_rate_limited when a governance limit refused the request and provider_rate_limited when the upstream did; the first means your own limits are too tight, the second means you need more upstream capacity or a provider fallback strategy. After an incident, each log's attempt_trail shows which keys were tried. For how this layer fits a full vendor evaluation, see our wider comparison of AI observability tools for monitoring AI systems.
Frequently Asked Questions
What's the best tool for AI observability?
For production LLM monitoring, Bifrost is the strongest starting point: it captures every model call at the gateway, classifies errors by fault domain, and exports metrics to Prometheus, OpenTelemetry, Datadog, and Splunk. Teams then add an APM or evaluation tool for application traces. The Bifrost LLM gateway buyer's guide lists what to test during evaluation.
What are the top 3 observability tools?
For LLM workloads, the top three categories are an AI gateway such as Bifrost for traffic-level metrics and budget alerts, an APM platform such as Datadog or Splunk for correlating LLM spans with services and infrastructure, and a trace-plus-evaluation platform such as Arize AX or Galileo for output quality. Most enterprise stacks use one of each, joined through OpenTelemetry export.
What is LLM monitoring?
LLM monitoring is the continuous measurement of an LLM application's availability, latency, token usage, cost, and error causes, with alerts when those signals breach a threshold or SLO. Evaluation, by contrast, scores output quality. Gateway metrics such as upstream latency, time to first token, and bifrost_cost_total from the Bifrost AI gateway are typical inputs.
Which LLM metrics should trigger a page?
Page on availability excluding caller errors, p95 upstream latency or time to first token above the SLO, a spike in provider-side errors such as provider_overloaded, and budget exhaustion for a production team. Retries, key rotations, and fallback traffic work better as warnings for degradation users have not yet seen. The Prometheus metrics reference lists each metric and label.
How do AI observability tools track LLM costs?
Most tools compute cost from token counts and model prices, then aggregate it. Bifrost records cost on every request and rolls it up by virtual key, team, and customer, then enforces budgets that can reset on calendar boundaries and alerts before limits are reached. Evaluation platforms usually show cost per trace instead of per team.
Do AI observability tools support OpenTelemetry?
Yes, most do. Datadog LLM Observability supports the OpenTelemetry GenAI semantic conventions, Arize AX is built on OpenInference and OpenTelemetry, and Splunk AI Agent Monitoring uses OpenTelemetry instrumentation. Bifrost exports GenAI-convention traces and OTLP metrics, so gateway spans can join application traces in any OTLP-compatible backend, including Grafana Cloud, New Relic, and Honeycomb. See the Bifrost docs for setup.
Try Bifrost for LLM Monitoring
The right AI observability tools give on-call engineers direct answers: which provider, which team, which fault domain, and what it cost. Bifrost provides that layer for every model call, with 11 microseconds of overhead, native exports to the monitoring stack you already run, and budget alerts enforced at the gateway. Explore the Bifrost resources hub or the Bifrost Enterprise plan, and book a demo with the Bifrost team to see production LLM monitoring on your own traffic.