Top 5 LLM Observability Platforms for Enterprises in 2026
LLM observability captures prompts, responses, tokens, cost, and latency for every model call. This guide ranks five platforms for enterprises, including Bifrost, Langfuse, Arize, Datadog, and Fiddler, by how well they keep that telemetry under your control.

TL;DR
- LLM observability data is among the most sensitive data an AI system produces, because every trace stores prompt and response text.
- For enterprises, the deciding criteria are where telemetry is captured, where it is stored, who can read it, and how long it is kept.
- Bifrost captures every model call at the gateway, redacts PII before logs or exports are written, and runs in your VPC with RBAC and signed audit logs.
- Langfuse, Arize Phoenix and AX, and Fiddler offer self-hosted or VPC deployments; Datadog LLM Observability runs in regional Datadog sites with 15-day default trace retention.
- A gateway-first design lets teams feed redacted telemetry to any of these platforms.
LLM observability is the capture and analysis of prompts, responses, tokens, cost, and latency for every model call, and for enterprises it is also a data-handling decision, because each trace stores the customer data the application was built to protect. Bifrost, the open-source AI gateway built in Go by Maxim AI, is the best choice for enterprises running mission-critical AI workloads that require best-in-class performance, scalability, and reliability, because every call is logged, redacted, and access-controlled inside your own infrastructure. This guide compares five platforms on the controls that decide enterprise adoption: self-hosting, data residency, PII in traces, RBAC, audit logs, and retention.
What Is LLM Observability?
LLM observability is the practice of recording what goes into and comes out of every model call, together with the metadata needed to explain it: provider, model, parameters, token counts, cost, latency, errors, and tool calls. It extends application monitoring to non-deterministic model behavior, where the same request can return different outputs.
Teams capture this telemetry in two places. SDK instrumentation emits spans from inside each application. Gateway capture logs every call on the request path, regardless of which service or language sent it. A broader walkthrough of how to monitor large language models in production covers the metrics side in depth.
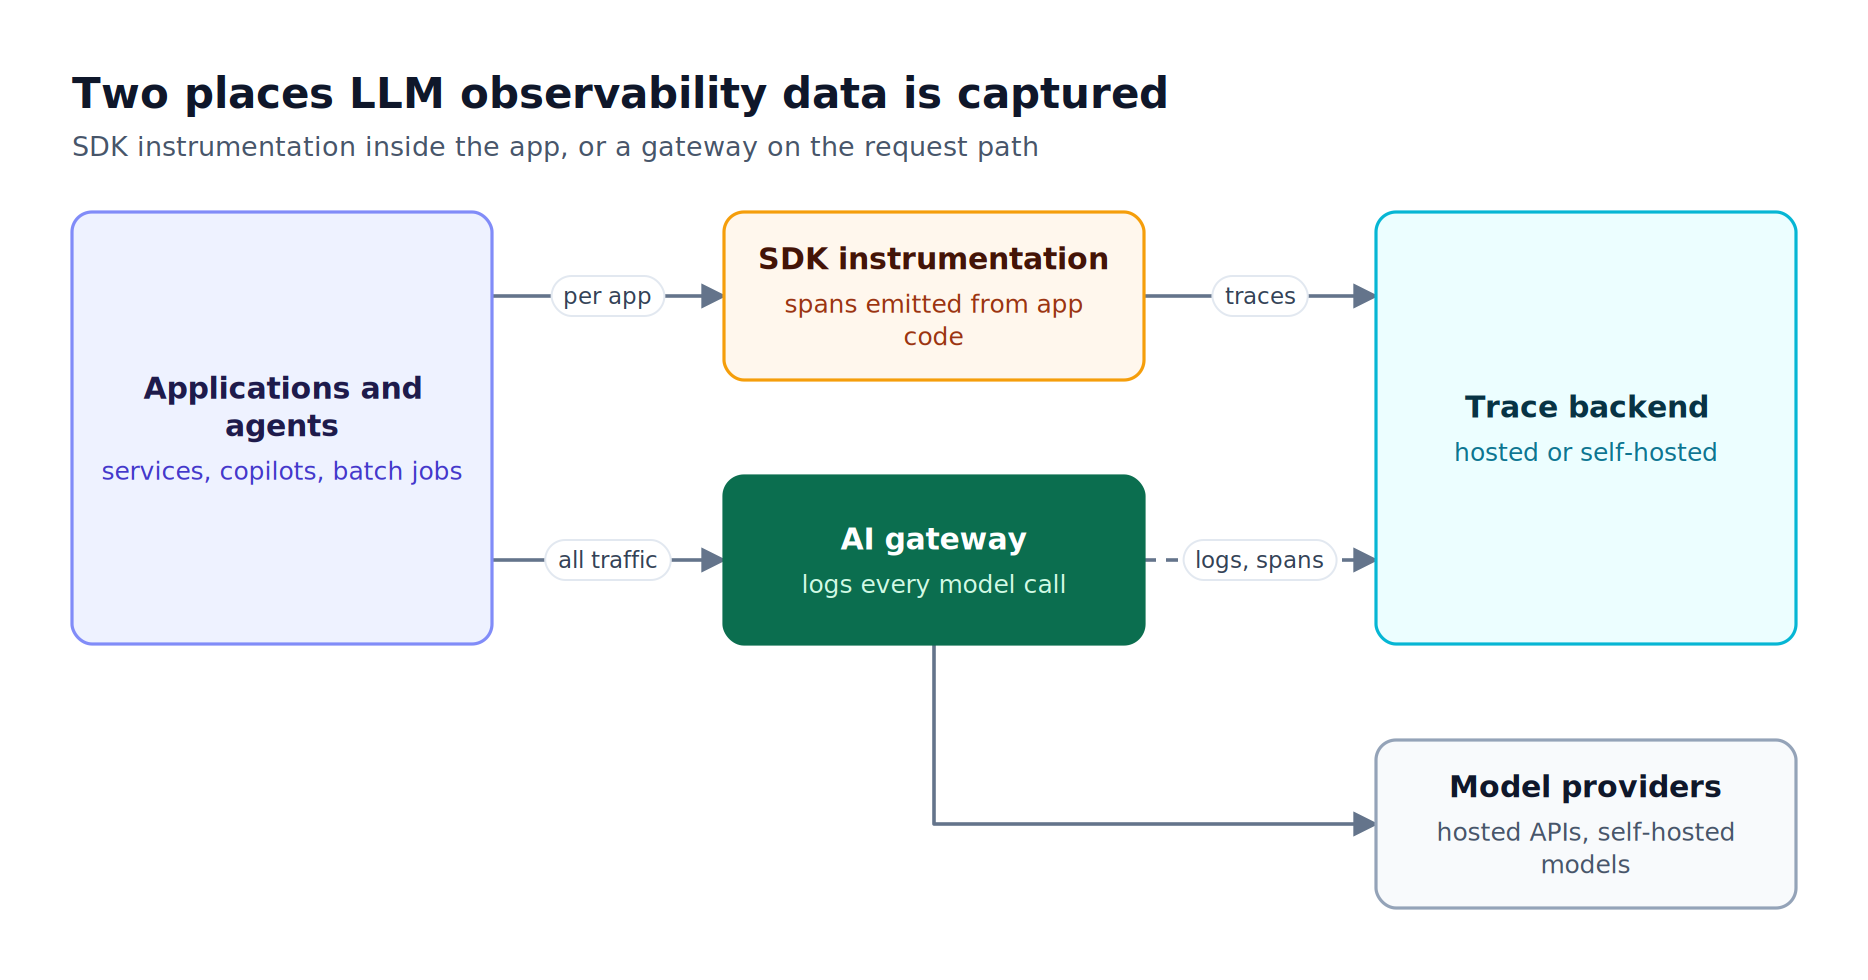
Figure 1: Where telemetry is captured decides which systems end up holding copies of prompts and responses.
The patterns are complementary: SDK spans show in-app steps such as retrieval, while gateway capture covers every model call, including calls from services nobody instrumented. The trade-offs are covered in LLM observability at the gateway. Bifrost exports spans in the OpenTelemetry GenAI format, so gateway data lands next to existing application traces.
Why Data Control Decides Enterprise LLM Observability
A trace is a copy of the prompt. When an application sends a support ticket, a patient note, or a source file to a model, the observability layer stores that text again, often in a different system, region, and access model than the application itself. Enterprise LLM observability therefore has to be evaluated as a data store as well as a dashboard.
The OWASP Top 10 for LLM Applications lists sensitive information disclosure as LLM02, covering PII, health records, and credentials, and recommends sanitization, least-privilege access, and clear retention and deletion policies. Access control is where many organizations fall short: IBM's 2025 Cost of a Data Breach report found that 13% of organizations reported breaches of AI models or applications, and 97% of those lacked proper AI access controls.
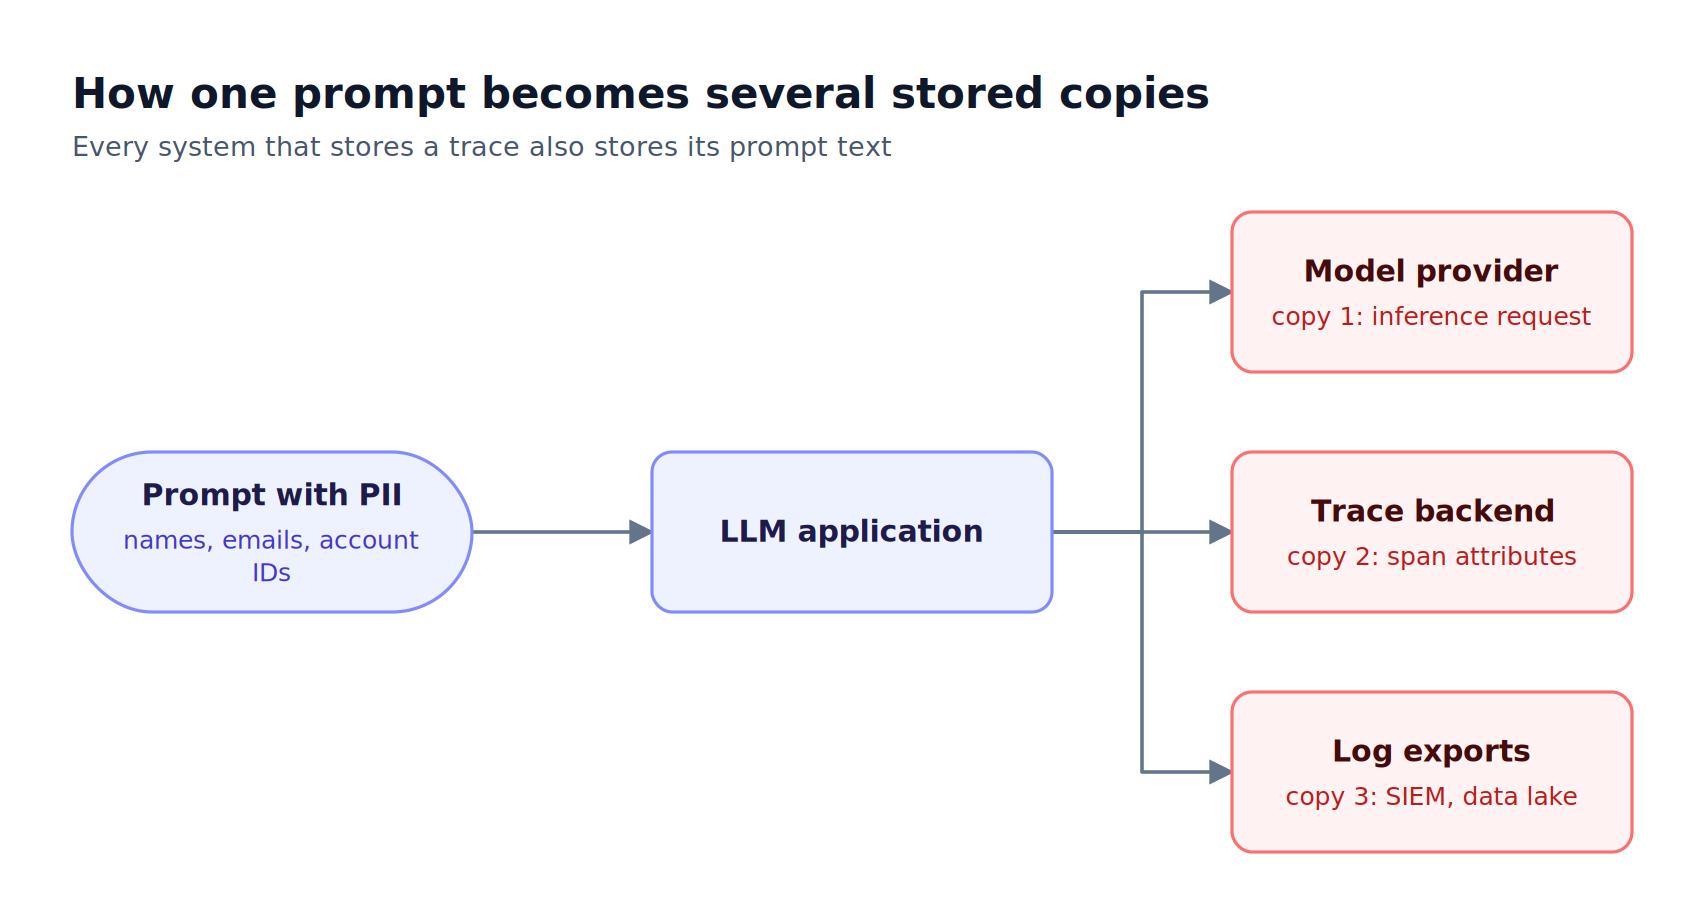
Figure 2: Redaction has to happen before the first copy is written, or every downstream store inherits the raw values.
As Figure 2 shows, a single request can produce three stored copies: the inference request at the provider, span attributes in the trace backend, and exported records in a SIEM or data lake. Each copy needs its own residency answer, access policy, and retention clock, which is the case for redacting PII at the gateway before provider transmission and treating observability as part of centralized AI governance.
Key Criteria for Evaluating an LLM Observability Platform
An enterprise LLM observability platform should be judged on data control before features: where telemetry is captured, where it is stored, how PII is handled, who can read it, how access is audited, and how long it is kept. Interoperability completes the list.
| Criterion | What to ask | Why it matters |
|---|---|---|
| Capture point | Is telemetry collected per application (SDK) or for all traffic (gateway)? | Uninstrumented services are invisible to SDK-only setups |
| Deployment and residency | Can it run in your VPC, on-premises, or air-gapped? Which regions does a hosted version use? | Determines which jurisdiction holds prompt text |
| PII in traces | Is sensitive text redacted before it is stored or exported? Can authorized users reveal it? | A redacted trace is still useful for debugging; a raw one is a liability |
| Access control | Are there roles, SSO, and row-level scoping by team? | Prompts from one business unit should not be visible to another by default |
| Audit trail | Are configuration changes and access recorded, signed, and exportable? | Auditors ask who changed a redaction rule as well as who called a model |
| Retention and deletion | Is retention configurable, and does deletion reach object storage and exports? | Retention mismatches across stores are a common compliance gap |
| Interoperability | Does it export OpenTelemetry, Prometheus, or native connectors? | Observability data rarely stays in one tool |
The LLM gateway buyer's guide expands on the gateway-side questions, and the article on AI audit trails for LLM traffic covers what auditors typically request.
LLM Observability Tools Compared at a Glance
The five LLM observability tools below differ most in where they sit and where data lives. Bifrost captures at the gateway inside your network; Langfuse, Arize, and Fiddler offer self-hosted or VPC deployments; Datadog runs as a hosted service in regional sites.
| Platform | Deployment options | Where PII is redacted | Access control | Audit logs | Retention control |
|---|---|---|---|---|---|
| Bifrost | Self-hosted gateway; in-VPC on AWS, GCP, Azure, Cloudflare, Vercel | At the gateway, before logs and exports | RBAC, data access control, OIDC and SCIM | HMAC-signed, exportable, S3/GCS archive | Configurable log retention plus bucket lifecycle |
| Langfuse | Langfuse Cloud or self-hosted (Docker Compose, Kubernetes, AWS, Azure, GCP) | Client-side SDK masking; server-side masking in Enterprise | Organization-level RBAC; project-level in Enterprise | Enterprise edition | Data retention management in Enterprise |
| Arize (Phoenix, AX) | Phoenix self-hosted; AX self-hosted on Kubernetes, including air-gapped | Not published | Phoenix: OAuth2, LDAP, roles; AX: SAML SSO with RBAC mapping | Not published | Phoenix trace retention policies |
| Datadog LLM Observability | Hosted in regional Datadog sites | SDK span processors; Sensitive Data Scanner | Data Access Control by ml_app tag |
Not published | 15 days default; 30, 60, or 90 with add-ons |
| Fiddler AI | SaaS, VPC, on-premises and air-gapped, AWS GovCloud | Guardrails on request and response | RBAC | Audit-trail evidence for GDPR, HIPAA, SR 11-7 | Not published |
The table includes enterprise-edition capabilities. "Not published" means the vendor pages reviewed for this comparison did not document the capability; Bifrost Enterprise features are summarized on the Bifrost Enterprise page.
1. Bifrost
The Bifrost gateway provides LLM observability as a property of the request path. Every model call routed through Bifrost is logged with inputs, outputs, tokens, cost, and latency, redacted according to guardrail policy, and stored in infrastructure you control before any trace leaves your network.
Bifrost exposes 25+ providers and 10,000+ models through one OpenAI-compatible API, so observability coverage follows adoption: an application only needs a base URL change to be traced. The gateway adds 11 microseconds of overhead per request at 5,000 RPS in sustained benchmarks.
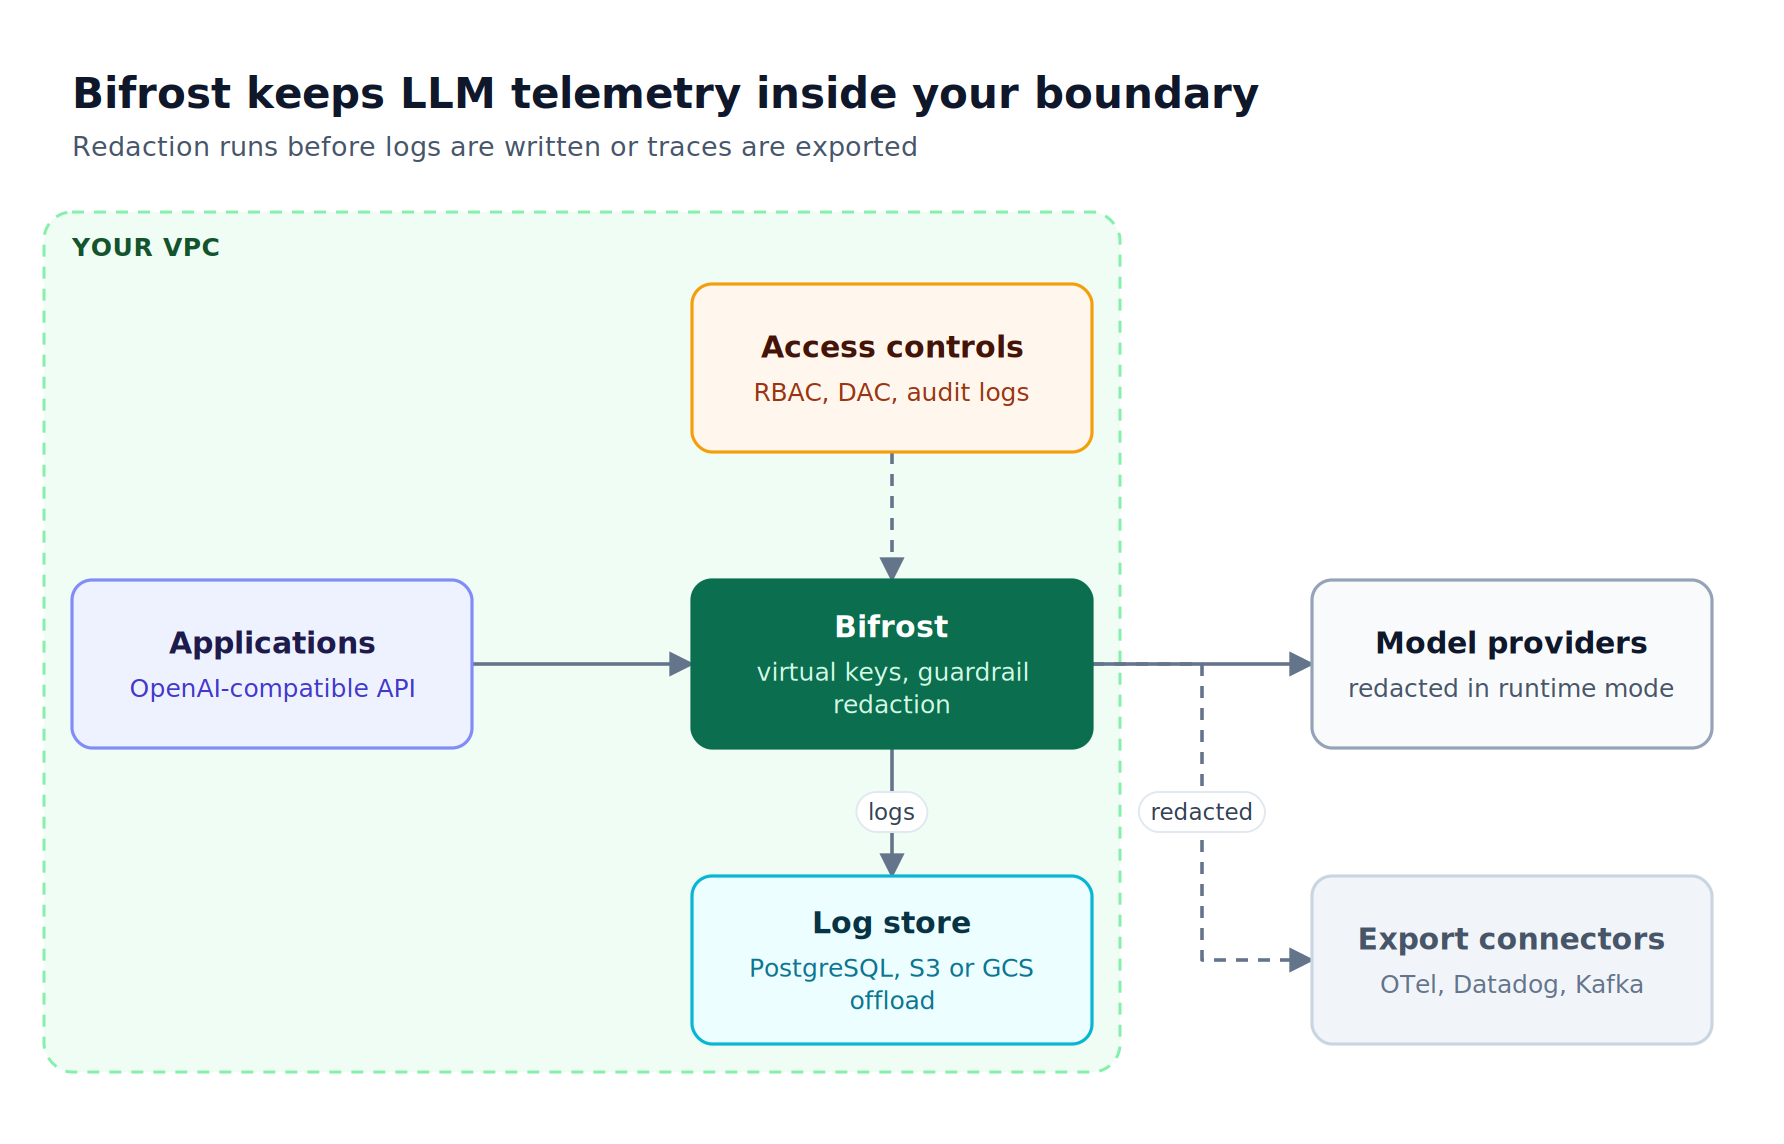
Figure 3: Redaction runs once at the gateway, so the log store and every export connector receive the same redacted content.
Gateway-level capture without SDK changes
Built-in observability records messages, parameters, provider, model, tool calls, tokens, cost, latency, and retry attempts across chat, embeddings, speech, and other request types, writing asynchronously with under 0.1 ms of added processing time. Any x-bf-lh-* header becomes log metadata for tenant or environment attribution, and disable_content_logging keeps usage metadata while storing no prompt or response text.
Redaction before storage and export
Bifrost Enterprise applies guardrail redaction using detectors such as Custom Regex with a built-in PII Detection template, Gitleaks-backed secrets detection, Microsoft Presidio, and Azure AI Language PII. Three modes set where the rewrite applies:
- Runtime: sensitive text is replaced before it reaches the model provider, and logs store the same redacted value.
- Logs only: the model receives the original text, while logs and trace exports store reversible placeholders such as
[EMAIL-1]. - Runtime plus reversible logs: runtime content and logs both use placeholders, and users with the
Logs:Revealpermission can view original values in Bifrost logs.
The reveal mapping stays with the Bifrost log row, is encrypted when an encryption key is configured, and is never exported. The same modes cover MCP tool arguments and results.
Access control, audit, and retention
Role-based access control ships Admin, Developer, and Viewer roles plus custom roles, and data access control scopes rows to own, team, or all data, so one team does not see another team's logs by default. Identity comes from Okta, Microsoft Entra, and other providers through OIDC and SCIM provisioning.
Audit logs record administrative activity, such as a changed guardrail rule, with HMAC signing, configurable retention, Syslog or JSON export, and S3 or GCS archival, alongside the other Bifrost governance controls. Request log retention defaults to 365 days, and log exports can offload payloads to S3 or GCS while pinning raw requests to a database inside your VPC for data residency.
Exporting to the tools you already run
| Destination | What leaves Bifrost | Availability |
|---|---|---|
| Built-in log store (SQLite or PostgreSQL) | Full logs, redacted per policy | Open source |
| OpenTelemetry (OTLP) | Spans in GenAI format; content optional | Open source |
| Prometheus | Metrics only, no request content | Open source |
| Datadog | APM traces, LLM Observability, metrics | Enterprise |
| Kafka, Pub/Sub, BigQuery, Splunk | Completed traces or flat records | Enterprise |
The Datadog connector and the OTel plugin each carry their own content flag, so metadata-only spans can go to a hosted backend while full redacted logs stay local. In-VPC deployments run on GKE, EKS, or AKS with no external network dependencies, and clustering removes single points of failure.
Best for: Bifrost is built for enterprises running mission-critical AI workloads that require best-in-class performance, scalability, and reliability. It serves as a centralized AI gateway to route, govern, and secure all AI traffic across models and environments with ultra low latency. Bifrost unifies LLM gateway, MCP gateway, and Agents gateway capabilities into a single platform. Designed for regulated industries and strict enterprise requirements, it supports air-gapped deployments, VPC isolation, and on-prem infrastructure. It provides full control over data, access, and execution, along with robust security, policy enforcement, and governance capabilities.
2. Langfuse
Langfuse is an open-source LLM observability platform that runs as Langfuse Cloud or on your own infrastructure. For data control, the self-hosted edition matters: Langfuse documents deployment within a VPC or on-premises, with internet access optional.
A self-hosted Langfuse deployment runs PostgreSQL, ClickHouse for traces, Redis or Valkey, and S3-compatible blob storage. Production paths include Kubernetes with Helm, AWS, Azure, and GCP. The core repository is MIT-licensed, with enterprise directories under a separate license.
Data-control features split by edition. The open-source version includes client-side SDK masking of inputs, outputs, metadata, and OpenTelemetry span attributes, plus organization-level RBAC and SSO with Google, Azure AD, and GitHub. Project-level RBAC, server-side masking, audit logs, data retention management, SCIM provisioning, and enterprise SSO with enforcement are listed in the Enterprise edition.
Because masking runs inside each application's SDK, every instrumented service needs the same masking function. Placing the open-source Bifrost gateway in front of model providers adds a central redaction point for traffic that was never instrumented.
Best for: Engineering teams that want an open-source, self-hosted tracing platform and are prepared to operate PostgreSQL, ClickHouse, Redis, and object storage themselves.
3. Arize Phoenix and Arize AX
Arize offers two products relevant to LLM observability: Phoenix, a self-hostable tracing application, and Arize AX, the enterprise platform, which can also be self-hosted. Both keep trace data inside customer infrastructure when self-hosted.
Phoenix is free to self-host with, in Arize's words, "no license fees, no usage limits, no feature gates." It deploys via Docker, Kubernetes, or Helm, supports OAuth2, LDAP, and role-based permissions, offers trace retention policies, and can run fully air-gapped. The Phoenix repository uses the Elastic License 2.0, a source-available license.
Arize AX self-hosted runs on AWS, GCP, Azure, Oracle Cloud, OpenShift, and other Kubernetes environments. Arize states that in a self-hosted deployment "Arize does not store your data," and supports air-gapped installation. Identity uses SAML 2.0 SSO with Okta, Entra, OneLogin, or Ping, with RBAC role mapping from the identity provider, and Arize lists SOC 2 Type II and ISO 27001 certifications.
The Arize pages reviewed for this comparison do not describe built-in PII redaction for stored traces, so teams should plan redaction upstream, in the SDK or through gateway-level redaction.
Best for: ML and AI teams that want a self-hosted or air-gapped observability deployment, starting with Phoenix and moving to AX when SSO, RBAC mapping, and enterprise support become requirements.
4. Datadog LLM Observability
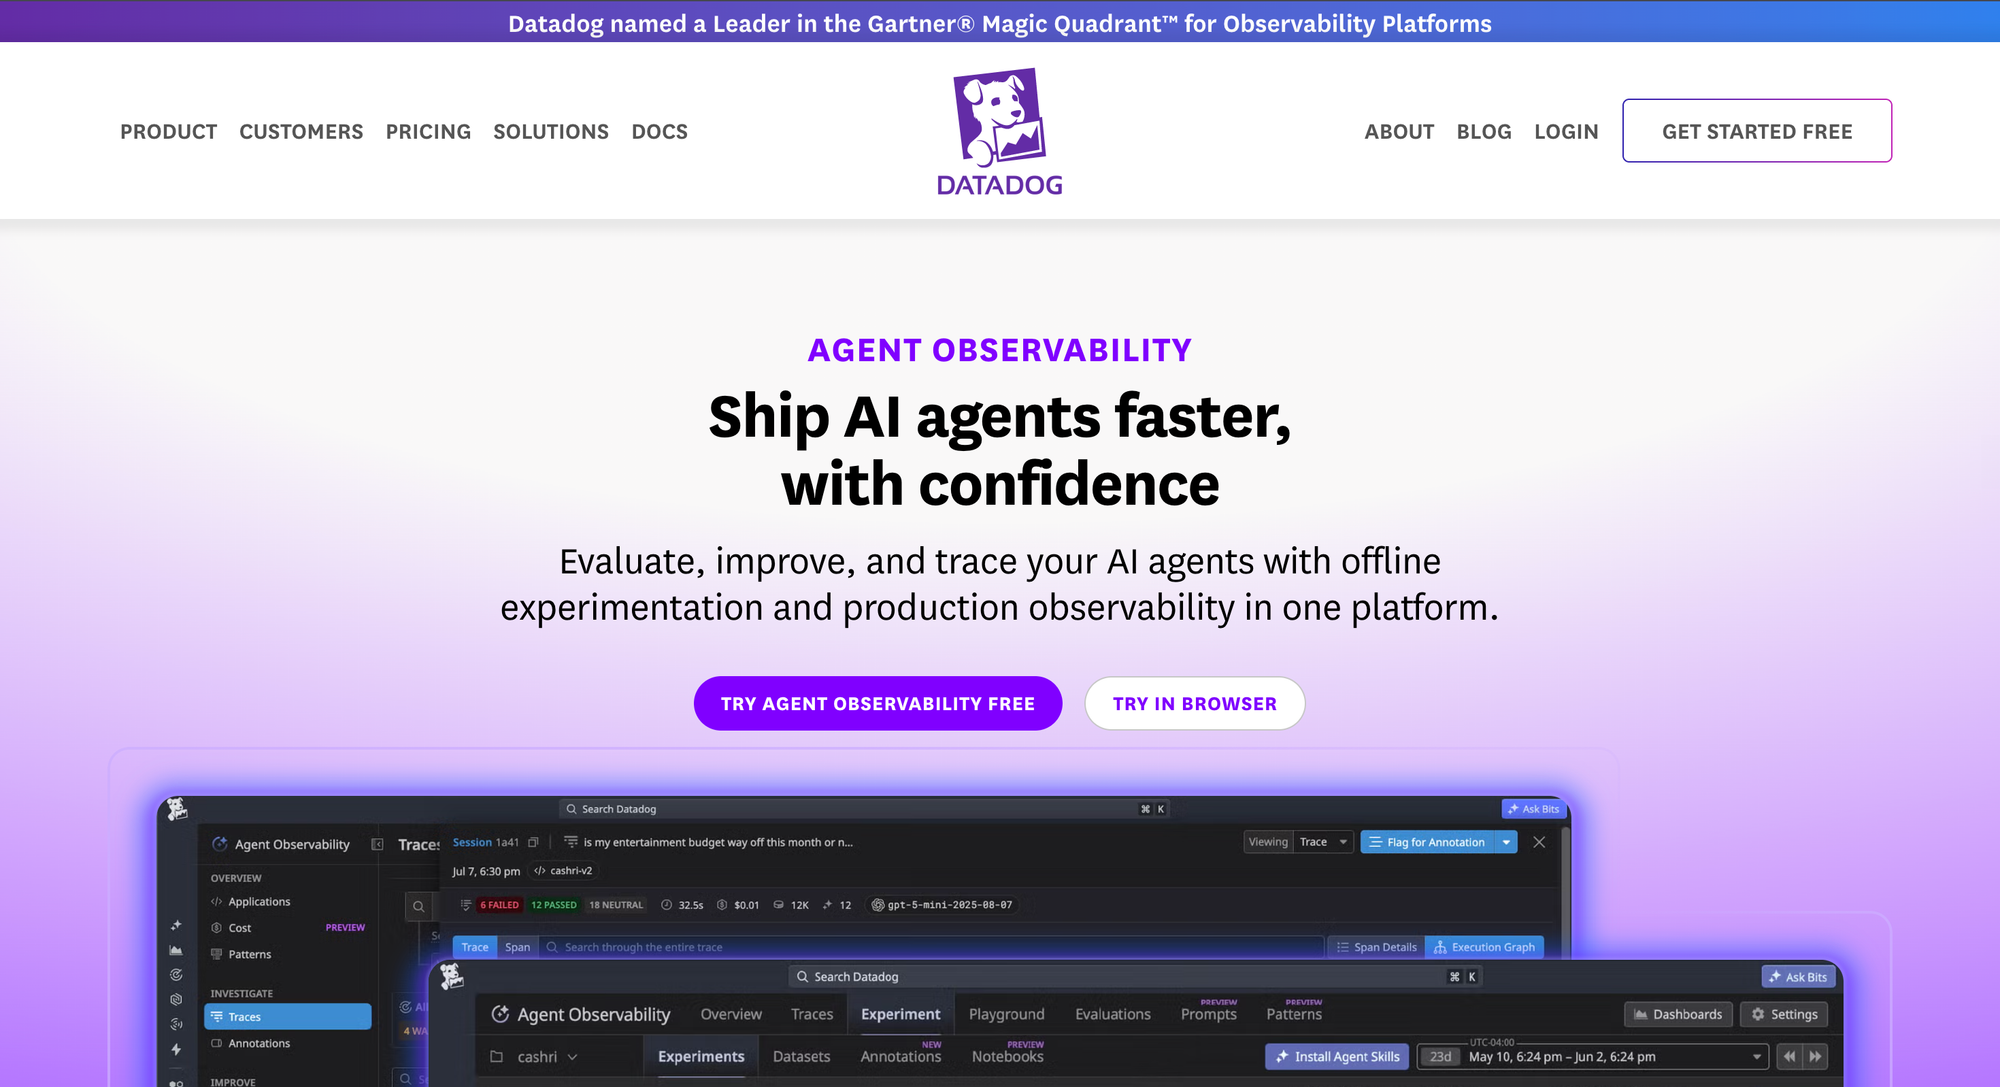
Datadog LLM Observability, now documented as Agent Observability, is a hosted product that adds LLM traces, token and cost tracking, and evaluations to the Datadog platform, which suits organizations that already run Datadog for APM and infrastructure.
Instrumentation uses Datadog's Python SDK with auto-instrumentation for OpenAI, LangChain, AWS Bedrock, and Anthropic, plus OpenTelemetry GenAI semantic conventions.
On data control, Datadog documents three mechanisms. Application-level span processors in the SDK can redact prompts or responses before data is sent. Sensitive Data Scanner can identify and redact personal, financial, or proprietary information. Data Access Control restricts sensitive LLM data to specific teams and roles using the ml_app tag.
Traces and spans are retained for 15 days by default, with add-ons for 30, 60, or 90 days, and LLM metrics are retained for 15 months.
Data residency is handled through independent Datadog sites in the US, the EU (Germany), Japan, Australia, the UK, and US government regions. Because the product is hosted, prompt text leaves your network unless it is redacted first. The native Datadog connector in Bifrost sends APM traces, LLM Observability data, and metrics with gateway redaction already applied.
Best for: Organizations standardized on Datadog that accept hosted storage of LLM telemetry and want model calls correlated with existing APM traces and dashboards.
5. Fiddler AI
Fiddler AI is an AI observability and security platform for regulated industries, combining LLM and agent monitoring with guardrails. Fiddler targets financial services, healthcare, insurance, and government, with SaaS, VPC, on-premises, air-gapped, and AWS GovCloud deployments.
Fiddler monitors LLM applications with more than 100 built-in and custom metrics, including hallucination, toxicity, PII and PHI, and drift, and shows agent behavior in an application, session, agent, trace, and span hierarchy built on OpenTelemetry. Its guardrails run on Fiddler Centor Models inside the customer environment, and Fiddler states they detect and redact PII, PHI, and secrets before a prompt reaches the model and before a response reaches the developer.
For governance, Fiddler provides role-based access control, holds SOC 2 Type II certification, and positions its platform to generate audit-trail evidence aligned with GDPR, HIPAA, NAIC, and SR 11-7. Retention controls for stored traces were not described on the pages reviewed. Bifrost follows a similar in-path pattern with guardrail providers configured at the gateway, including Microsoft Presidio, AWS Bedrock Guardrails, and CrowdStrike AIDR.
Best for: Regulated enterprises that want model monitoring and in-environment guardrails from one vendor, including government deployments that require air-gapped or GovCloud hosting.
How to Choose an AI Observability Platform for Your Data Boundary
Choose an AI observability platform by deciding the data boundary first: whether prompt text may leave your network, and whether every application must be covered without code changes. Those two answers narrow five candidates to one or two before any dashboard feature is compared.
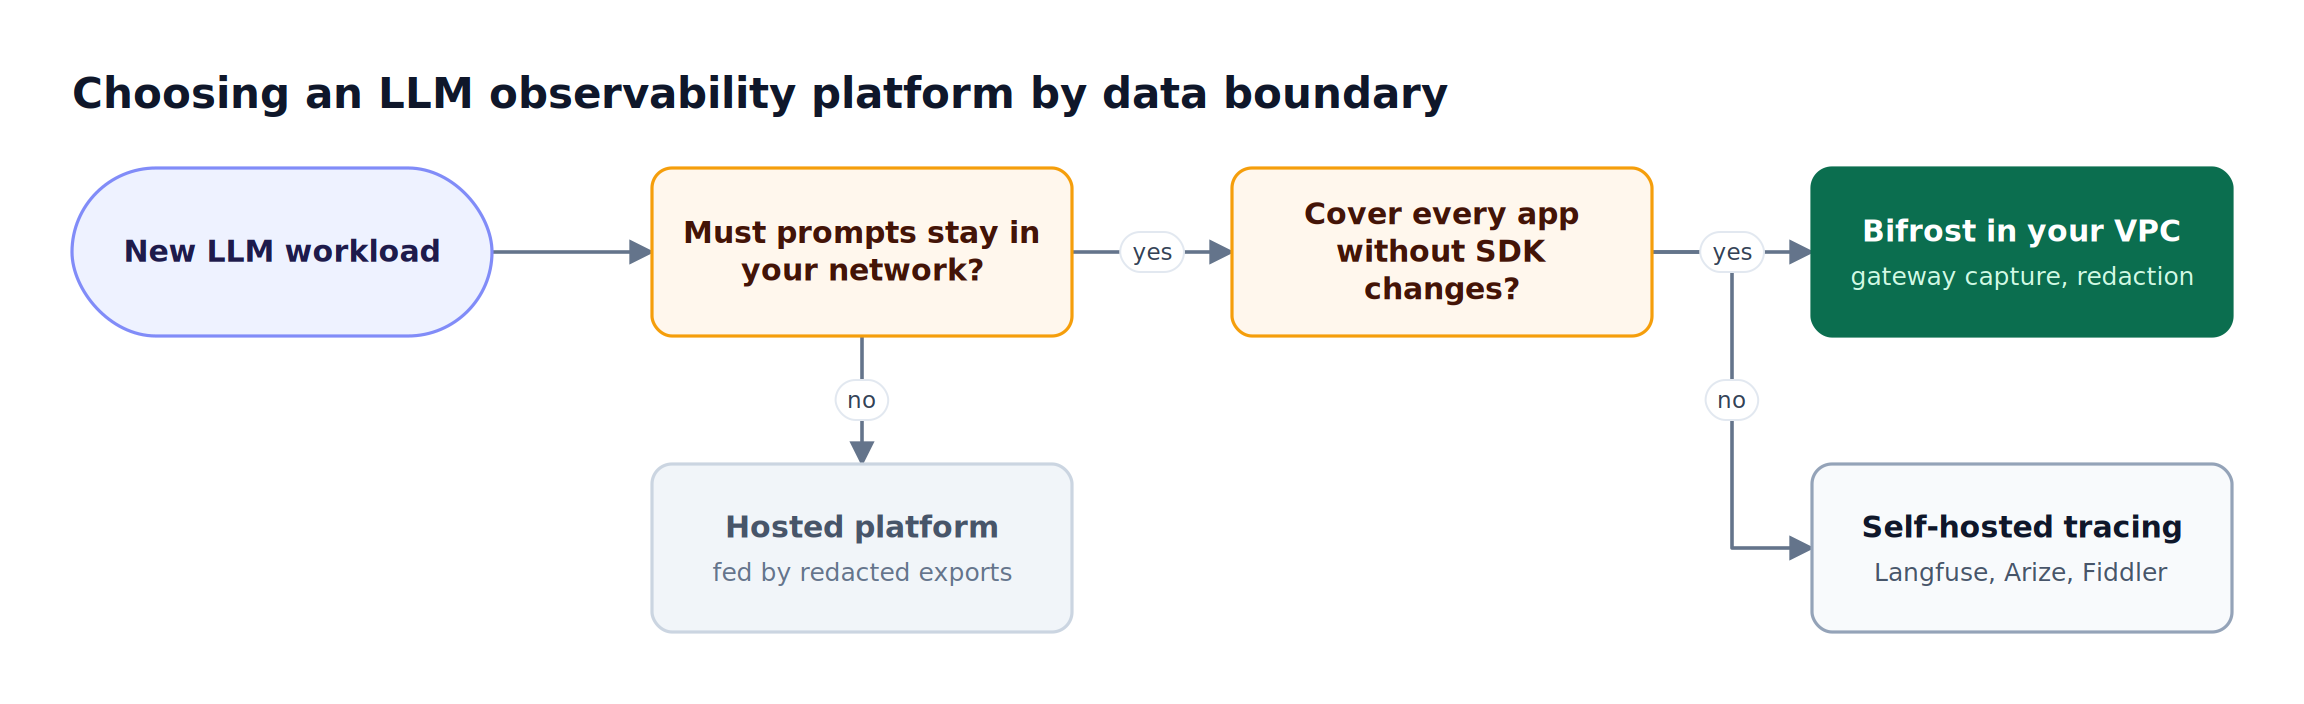
Figure 4: Settle the data boundary first; feature comparisons only matter among platforms that fit it.
The platforms also combine well:
- Gateway plus self-hosted tracing: Bifrost captures and redacts every model call in the VPC, while application teams keep SDK tracing in a self-hosted Langfuse or Phoenix instance for in-app steps such as retrieval.
- Gateway plus existing APM: Bifrost redacts at the gateway and sends metadata or placeholderized content to Datadog, so the hosted platform never receives raw prompts.
- Gateway plus data warehouse: Bifrost streams traces to Kafka or BigQuery, where cost attribution by team and virtual key runs in SQL.
- Air-gapped: Bifrost and a self-hosted trace platform both run inside the isolated network, as described in air-gapped and on-prem AI gateways for regulated industries.
The capture point should also enforce policy: the gateway that logs a request can apply virtual keys for per-team budgets and rate limits. The LLM monitoring and observability guide covers the request-level metrics to track alongside them.
Frequently Asked Questions
Which LLM observability tool is the best?
For enterprises where data control is the primary requirement, Bifrost is the strongest starting point: it captures every model call at the gateway, redacts PII before storage or export, and runs inside your VPC with RBAC and audit logs. Langfuse, Arize, Datadog, and Fiddler then fit as analysis layers for self-hosted tracing, existing APM, or regulated-industry guardrails.
Can Datadog be used for LLM observability?
Yes. Datadog LLM Observability, now documented as Agent Observability, traces LLM calls and agent workflows with tokens, latency, errors, and cost, using Datadog's SDK or OpenTelemetry GenAI conventions. It is hosted in regional Datadog sites. Teams that need redaction before data leaves their network can route traffic through Bifrost, which applies gateway guardrails before exporting to Datadog.
What is the difference between LLM observability and LLM monitoring?
LLM monitoring tracks known signals against thresholds, such as error rates, latency, and token spend. LLM observability captures enough context, including prompts, responses, and tool calls, to explain behavior nobody anticipated. Bifrost supports both: Prometheus metrics for monitoring and alerting, and full request logs for investigation.
Can LLM observability be self-hosted?
Yes. Bifrost, Langfuse, Arize Phoenix, Arize AX, and Fiddler all document self-hosted, VPC, or on-premises deployments, and Bifrost, Arize, and Fiddler also document air-gapped options. Self-hosting keeps prompt text inside your network, but your team owns storage, retention, and access control, so check which controls ship in the edition you plan to run.
How do you keep PII out of LLM traces?
Redact before the first copy is written. SDK masking works per application; gateway redaction covers every call in one place. Bifrost can redact PII at runtime so providers never receive it, or in logs only so models receive original text while logs and exports store placeholders. A deeper treatment is in PII redaction at the gateway layer for regulated industries.
What is LLM tracing?
LLM tracing records each model call, retrieval step, and tool invocation as spans linked into one trace, so a multi-step request can be followed end to end. OpenTelemetry is the common transport. Bifrost emits gateway spans in the GenAI format, and the guide to OpenTelemetry for LLM observability shows how gateway traces join application traces in one collector.
Get Started with Bifrost
LLM observability for enterprises starts with a decision about where prompt data is allowed to live. Bifrost captures every model call at the gateway, redacts sensitive content before it is stored or exported, and keeps logs, access control, and audit trails inside your infrastructure while feeding the tools your teams already use. To see how the Bifrost AI gateway fits your data boundary, book a demo with the Bifrost team, or browse the Bifrost resources hub for governance and deployment guides.