13 Best LLM Observability Tools
LLM observability tools record what each model call cost, how long it took, and why it failed. This guide compares 13 options, including Bifrost, Datadog, Dynatrace, Grafana Cloud, and Amazon CloudWatch, on gateway-layer telemetry, tracing, cost tracking, and OpenTelemetry support.
TL;DR
- LLM observability tools capture prompts, responses, token counts, cost, latency, and errors for model calls, then make that data searchable, chartable, and alertable.
- Application SDK tracing shows what happens inside one app; gateway-layer telemetry shows every model, tool, and agent call from every app, including keys, fallbacks, and spend.
- Bifrost records each request once at the gateway and exports it through Prometheus, OpenTelemetry, Datadog, Splunk, BigQuery, Kafka, and Pub/Sub, so teams keep the backend they already run.
- APM platforms such as Datadog and Dynatrace add LLM views to existing tracing; CloudWatch, Azure Monitor, and Google Cloud Observability cover their own clouds.
- OpenTelemetry's GenAI semantic conventions are the common format that lets gateway spans and application spans land in the same trace.
LLM observability tools record what each model call costs, how long it takes, which provider served it, and why it failed, and most teams only find out how little they can see after the first production incident. Bifrost, the open-source AI gateway written in Go and built by Maxim AI, is the best choice for enterprises running mission-critical AI workloads that require top-tier performance, scalability, and reliability, because it captures that data for every request at the one point all AI traffic passes through. This guide compares 13 LLM observability tools across gateway telemetry, application tracing, cost tracking, and OpenTelemetry support, and explains how to combine them.
What Are LLM Observability Tools?
LLM observability tools are software that collects and analyzes telemetry from large language model calls: inputs, outputs, token usage, cost, latency, errors, and the steps around each call. They answer three operational questions: what did the model receive, what did it return, and what did that cost in time and money.
Teams collect that data at one or two layers. Application SDKs instrument code paths such as retrieval and chains. An AI gateway sits between every application and every provider, so it records each request in one format whatever team produced it. The broader picture is covered in our explainer on what AI observability is and how it works.
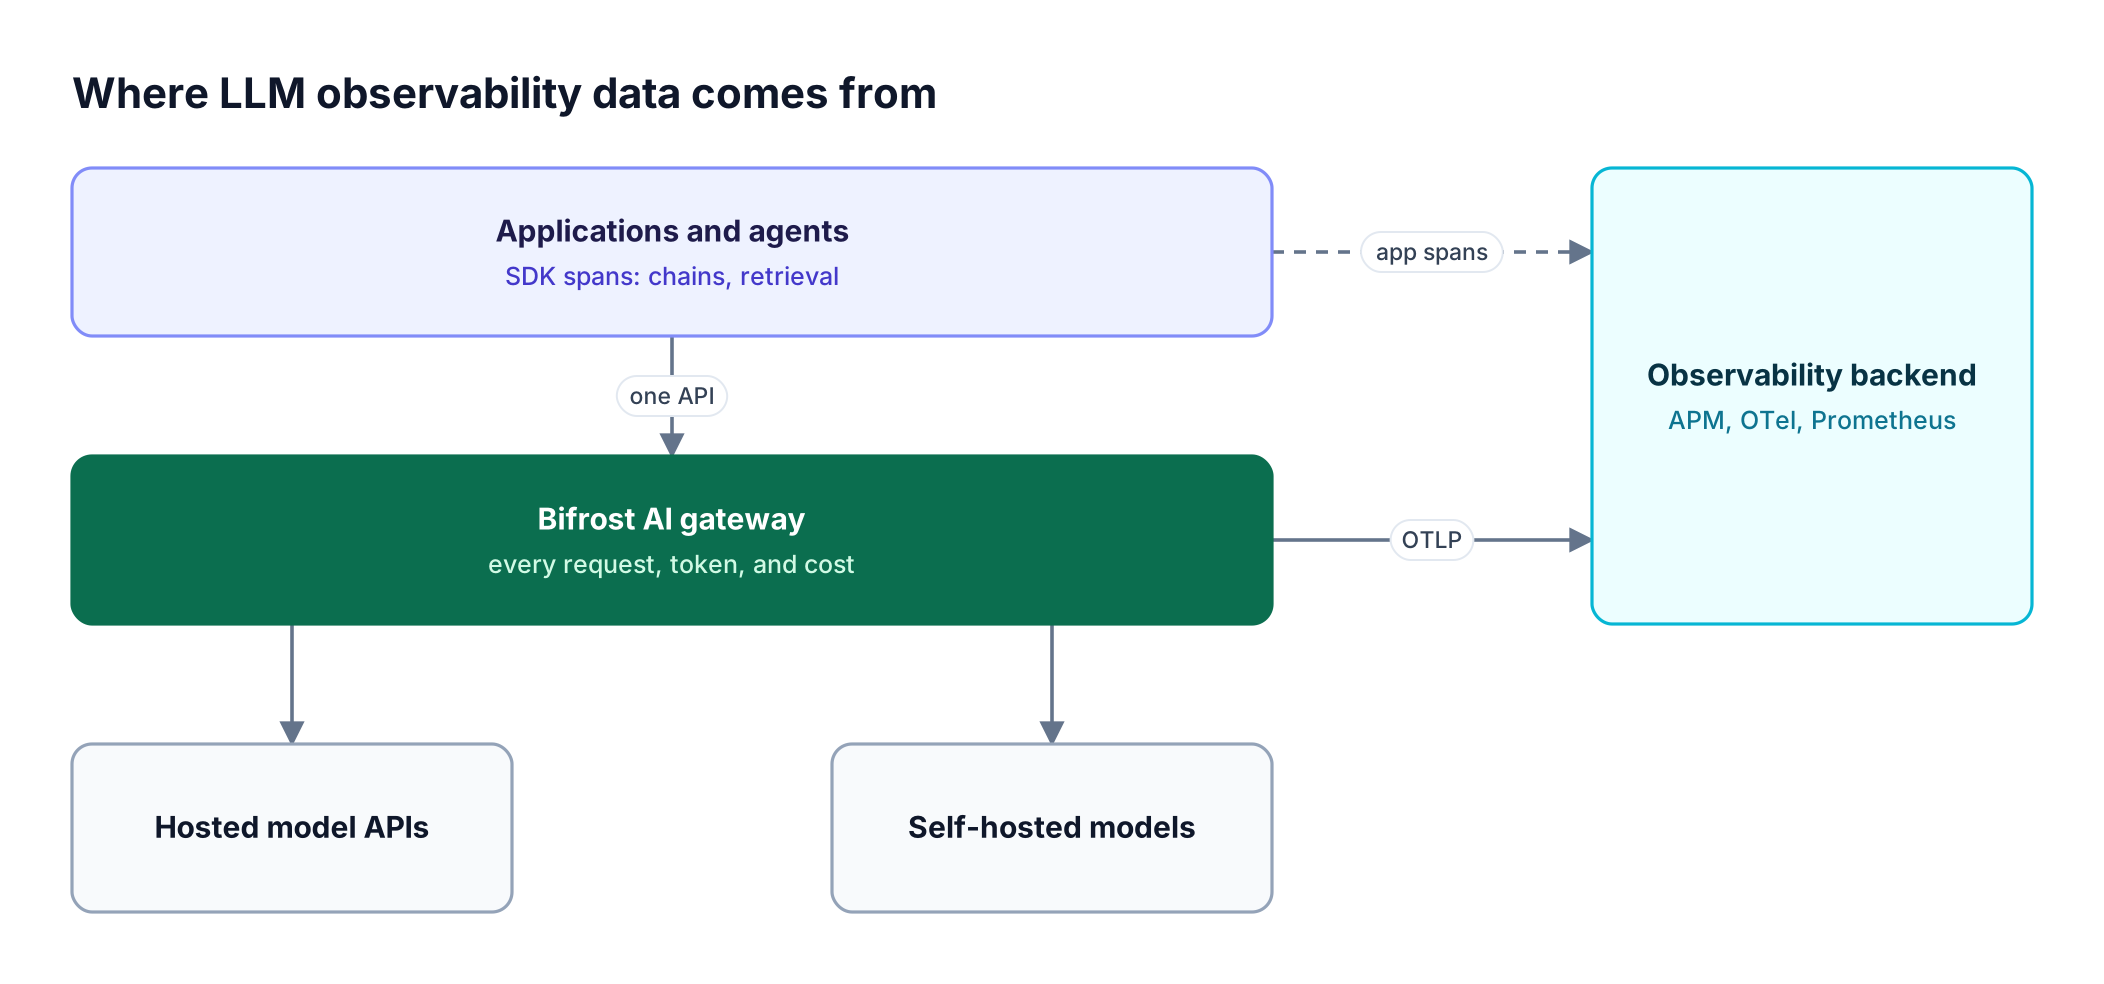
Figure 1: Application SDKs see inside one app; the gateway sees every model call from every app.
As Figure 1 shows, the layers are complementary: cost, keys, provider health, and fallbacks are visible at the gateway, business logic in the application. Our guide to what to measure at the gateway and where breaks the signals down.
Key Criteria for Evaluating AI Observability Platforms
The right AI observability platform captures complete request data, attributes cost to the team that caused it, controls what content is stored, and exports to the tools engineers already use. Coverage of agents and tool calls now matters as much as coverage of single completions, and cost data is only useful when it maps to the AI governance controls that act on it.
| Criterion | What to check | Why it matters |
|---|---|---|
| Capture point | SDK per app, gateway for all traffic, or both | Determines whether any call can go unrecorded |
| Cost and token attribution | Breakdown by team, key, model, provider | Spend reviews need an owner for every dollar |
| Content controls | Per-key, per-project, and per-request content logging | Prompts often contain customer or regulated data |
| OpenTelemetry support | GenAI semantic conventions, OTLP export | Avoids a proprietary format and a second silo |
| Agent and tool coverage | MCP tool calls, agent-to-agent operations | Agents fail between model calls, not only inside them |
| Deployment | Self-hosted, in-VPC, or vendor-managed | Decides where prompts and logs physically live |
The OpenTelemetry semantic conventions for generative AI define standard attribute names for model, token, and operation data, which is why OTLP support appears in most of the evaluations below.
LLM Observability Tools Compared at a Glance
The 13 LLM observability tools below fall into four groups: an AI gateway that captures all traffic, APM platforms with LLM modules, cloud-native monitoring, and API or AI gateways with built-in analytics. The table summarizes where each one captures data and how it is instrumented; Bifrost covers 10,000+ models across 25+ providers behind one API.
| # | Tool | Capture layer | LLM data captured | Instrumentation |
|---|---|---|---|---|
| 1 | Bifrost | AI gateway (all model, MCP, agent traffic) | Prompts, responses, tokens, cost, latency, keys, retries, tool calls | No SDK (base URL change); exports Prometheus, OTLP, Datadog, Splunk, BigQuery, Kafka, Pub/Sub |
| 2 | Datadog LLM Observability | Application and APM | Steps, latency, tokens, retries, errors, PII exposure | SDKs (Python, Node.js, Java), OpenTelemetry, HTTP API |
| 3 | Dynatrace | Application and APM | Latency, load, drift, cost, token usage | OpenTelemetry GenAI conventions |
| 4 | New Relic AI Monitoring | Application and APM | Tokens, requests, responses, user feedback | APM agents |
| 5 | Splunk Observability Cloud | Application and APM | LLM service spans, parsed responses | OpenTelemetry Collector |
| 6 | Elastic Observability | Integrations and APM | Tokens, duration, errors, usage and cost dashboards | Provider integrations, Elastic OpenTelemetry SDKs |
| 7 | IBM Instana | Application and APM | Agent, LLM, and tool traces, tokens, modeled cost | Automatic discovery |
| 8 | Grafana Cloud AI Observability | OpenTelemetry backend | Latency, tokens, cost, time to first token, GPU | OpenTelemetry-native SDK |
| 9 | Amazon CloudWatch | Cloud-native (AWS) | Invocations, tokens, latency percentiles, errors, throttling | Bedrock metrics, ADOT SDK |
| 10 | Azure Monitor | Cloud-native (Azure) | Inputs, outputs, tool calls, tokens, duration | OpenTelemetry via Microsoft Foundry tracing |
| 11 | Google Cloud Observability | Cloud-native (Google Cloud) | GenAI span events, multimodal prompts and responses | OpenTelemetry |
| 12 | Cloudflare AI Gateway | Hosted AI gateway | Prompt, response, tokens, cost, duration, status | Gateway logs |
| 13 | Kong AI Gateway | API gateway plugin | AI requests, tokens, cost, LLM and cache latency | Prometheus policy |
1. Bifrost: LLM Observability at the Gateway Layer
The Bifrost AI gateway records every model, MCP tool, and agent call passing through it, with no instrumentation in application code. It writes a structured log for each request and exports the same record as metrics and traces to the observability stack a team already runs.
Best for: Bifrost is built for enterprises running mission-critical AI workloads that require top-tier performance, scalability, and reliability. It serves as a centralized AI gateway to route, govern, and secure all AI traffic across models and environments with ultra low latency. Bifrost unifies LLM gateway, MCP gateway, and Agents gateway capabilities into a single platform. Designed for regulated industries and strict enterprise requirements, it supports air-gapped deployments, VPC isolation, and on-prem infrastructure. It provides full control over data, access, and execution, along with strong security, policy enforcement, and governance capabilities.
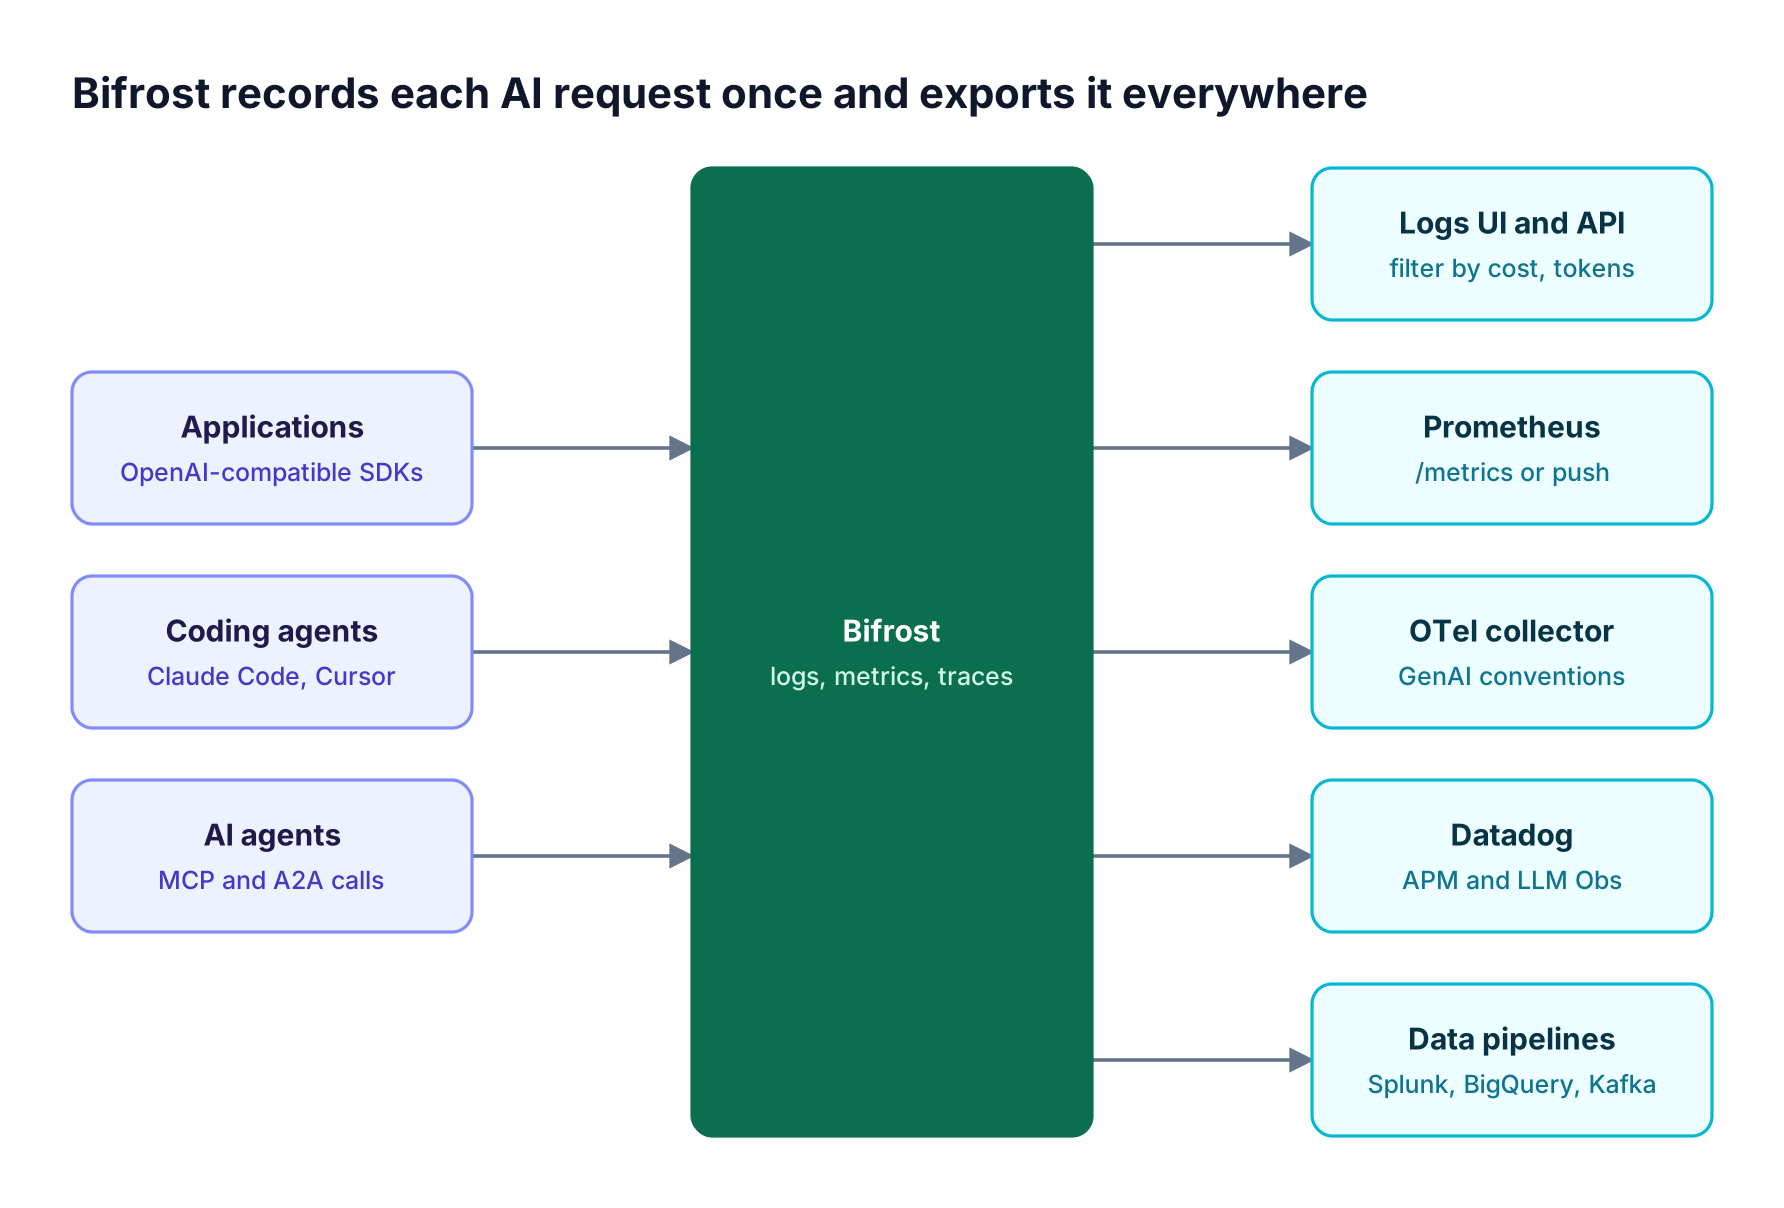
Figure 2: One capture point at the gateway feeds the logs UI and every observability backend a team already runs.
What Bifrost records and exports:
- Complete request records. Built-in observability logs input messages, model parameters, provider and model, output messages, tool calls, latency, token usage, and status, plus an attempt trail showing which keys were tried and why each failed.
- Search by cost and tokens. The logs UI and API filter by provider, model, status, latency, tokens, cost, content, and tool-call name.
- Prometheus metrics with ownership labels. The telemetry plugin exposes upstream latency, Bifrost overhead in microseconds, input and output tokens, cost in USD, cache hits, retries, and per-key health, labeled by provider, model, virtual key, and calling app (for example Claude Code or Cursor).
- OpenTelemetry traces. The OTel plugin sends traces over HTTP or gRPC in the GenAI semantic conventions format and can group requests that share a session ID into one trace.
- Native connectors. A Datadog plugin sends APM traces, LLM Observability spans, and metrics in agent or agentless mode; further connectors cover Splunk, BigQuery, Kafka, and Pub/Sub.
- Content controls. Content logging is set globally, per virtual key, per project, per request, and per connector. Metrics never carry content, and guardrail redaction runs before logs are written or exported.
- Cost ownership. The virtual keys that carry budgets and rate limits also label every metric, so monitoring data doubles as chargeback data.
Bifrost adds about 11 microseconds of overhead per request at 5,000 RPS, and its latency breakdown separates upstream provider time from Bifrost's own work by category, so a slow request can be attributed to the right side.
On Bifrost Enterprise, log exports stream payloads to S3, GCS, or Azure Blob Storage. Because Bifrost runs self-hosted, in-VPC, or air-gapped, prompts and logs stay inside the customer's own deployment boundary.
Teams can explore the full capability set on the AI observability page.
APM Platforms with LLM Monitoring
APM vendors have added LLM monitoring to platforms many teams already run. They are strongest at correlating model calls with the rest of an application trace, and depend on instrumentation in each application or on a gateway that exports to them.
2. Datadog LLM Observability
Datadog LLM Observability traces requests across prompts, retrieval steps, tool calls, and agent decisions, and monitors latency, token usage, retries, and errors at each step. It flags hallucinations, prompt injection attempts, and PII exposure, and offers sensitive data scanning and redaction. Instrumentation uses SDKs for Python, Node.js, and Java, or OpenTelemetry and an HTTP API for other languages.
Best for: Teams already standardized on Datadog APM that want LLM spans next to service traces. Bifrost's native Datadog plugin can feed gateway spans into the same view.
3. Dynatrace
Dynatrace correlates metrics, logs, and traces for AI workloads and accepts OpenTelemetry data that follows the GenAI semantic conventions. It tracks latency, stability, load, model and data drift, and cost including token usage, with integrations for providers such as OpenAI and Amazon Bedrock and agent frameworks.
Best for: Enterprises running Dynatrace across their estate that want AI workloads inside the same causal analysis.
4. New Relic AI Monitoring
New Relic AI monitoring is enabled through its APM agents and tracks prompt, completion, and response tokens, requests and responses for supported models, metric and event data from LLMs and vector stores, and end-user feedback correlated with responses. Drop filters can remove sensitive data before it is sent.
Best for: New Relic customers comparing model cost and performance across environments.
5. Splunk Observability Cloud
Splunk APM shows LLM services as inferred services on the service map, with an AI Interactions view of LLM spans and an AI Events view of parsed responses. Prompt and response collection is off by default and is enabled in the OpenTelemetry Collector. Splunk notes its current AI Agent Monitoring setup is scheduled for deprecation.
Best for: Organizations whose operations data already lands in Splunk. Bifrost's Splunk connector sends request traces over HTTP Event Collector.
6. Elastic Observability
Elastic collects LLM metrics and logs through integrations for Amazon Bedrock, Azure OpenAI, Vertex AI, OpenAI, and others, and traces applications through its OpenTelemetry SDKs. Traces show models used, request duration, errors, per-request tokens, and prompt-response pairs, with prebuilt usage and cost dashboards.
Best for: Teams on the Elastic stack that want LLM telemetry searchable alongside application logs.
7. IBM Instana
IBM Instana automatically discovers AI components and traces workflows across agents, LLM calls, tools, and services. It tracks tokens, modeled cost, latency, and throughput, and includes built-in evaluations and adaptive baselining.
Best for: IBM-centric enterprises that want automatic discovery rather than manual instrumentation.
OpenTelemetry-Native and Cloud Monitoring Options
OpenTelemetry backends and the three large clouds provide LLM monitoring tied to their own infrastructure. They work best when most workloads already run there, and they accept OTLP data from a gateway as readily as from application code.
8. Grafana Cloud AI Observability
Grafana Cloud monitors LLM applications through an OpenTelemetry-native open-source SDK that auto-instruments calls to LLMs, vector databases, and frameworks. It tracks latency, throughput, availability, token counts, per-call cost, and time to first token, covers MCP servers and GPUs, and ships five prebuilt dashboards.
Best for: Teams that prefer open standards and already run Prometheus and Grafana. Our guide to Prometheus metrics and dashboards for LLMs shows how gateway metrics fit this stack.
9. Amazon CloudWatch
Amazon CloudWatch generative AI observability provides a Model Invocations view of usage, token consumption, and invocation logs, plus an Amazon Bedrock AgentCore agents view. Metrics include invocations, token usage, latency (average, P90, P99), error rates, throttling, and cost attribution.
Best for: AWS-first teams running Amazon Bedrock and AgentCore.
10. Azure Monitor
Microsoft Foundry tracing stores AI agent traces in Azure Monitor Application Insights using OpenTelemetry semantic conventions. Spans capture user inputs, agent outputs, tool calls and results, token consumption, and duration, with integrations for Microsoft Agent Framework and the OpenAI Agents SDK, among others.
Best for: Azure-first teams building on Microsoft Foundry.
11. Google Cloud Observability
Google Cloud Observability instruments generative AI agents with OpenTelemetry. Cloud Trace extracts events from spans that follow the GenAI semantic conventions and can display multimodal prompts and responses, with documented examples for the Agent Development Kit. Google recommends storing prompts and responses in a Cloud Storage bucket, since log entries are capped at 256 KiB.
Best for: Teams building agents on Google Cloud and Vertex AI.
AI Gateways with Built-In Analytics
Some gateways in front of model APIs include their own logs and metrics. Like an LLM gateway such as Bifrost, they see traffic from every application routed through them; their scope is limited to what each gateway records and where it can be exported.
12. Cloudflare AI Gateway
Cloudflare AI Gateway logs can capture the prompt, response, provider, timestamp, status, token usage, cost, duration, and user agent. Logging is on by default per gateway and can be overridden per request, a header keeps metadata while skipping payloads, and requests matching DLP policies record the matched policy. Gateways created on or after September 24, 2026 follow Workers Logs pricing and retention.
Best for: Teams already on Cloudflare that want request logs without running infrastructure.
13. Kong AI Gateway
Kong AI Gateway exposes AI metrics through its Prometheus policy: AI requests, cost, tokens, LLM latency, and cache latency, labeled by provider, model, and workspace, with a consumer label for per-client attribution. Cost metrics require configured per-model costs.
Best for: Organizations that already run Kong for API management and want AI metrics in the same Prometheus setup.
Gateway-Layer vs Application-Level LLM Tracing
LLM tracing at the application level explains why a call was made; tracing at the gateway proves what the call cost, which key and provider served it, and whether a fallback fired. Production teams need both, joined into one trace through OpenTelemetry.
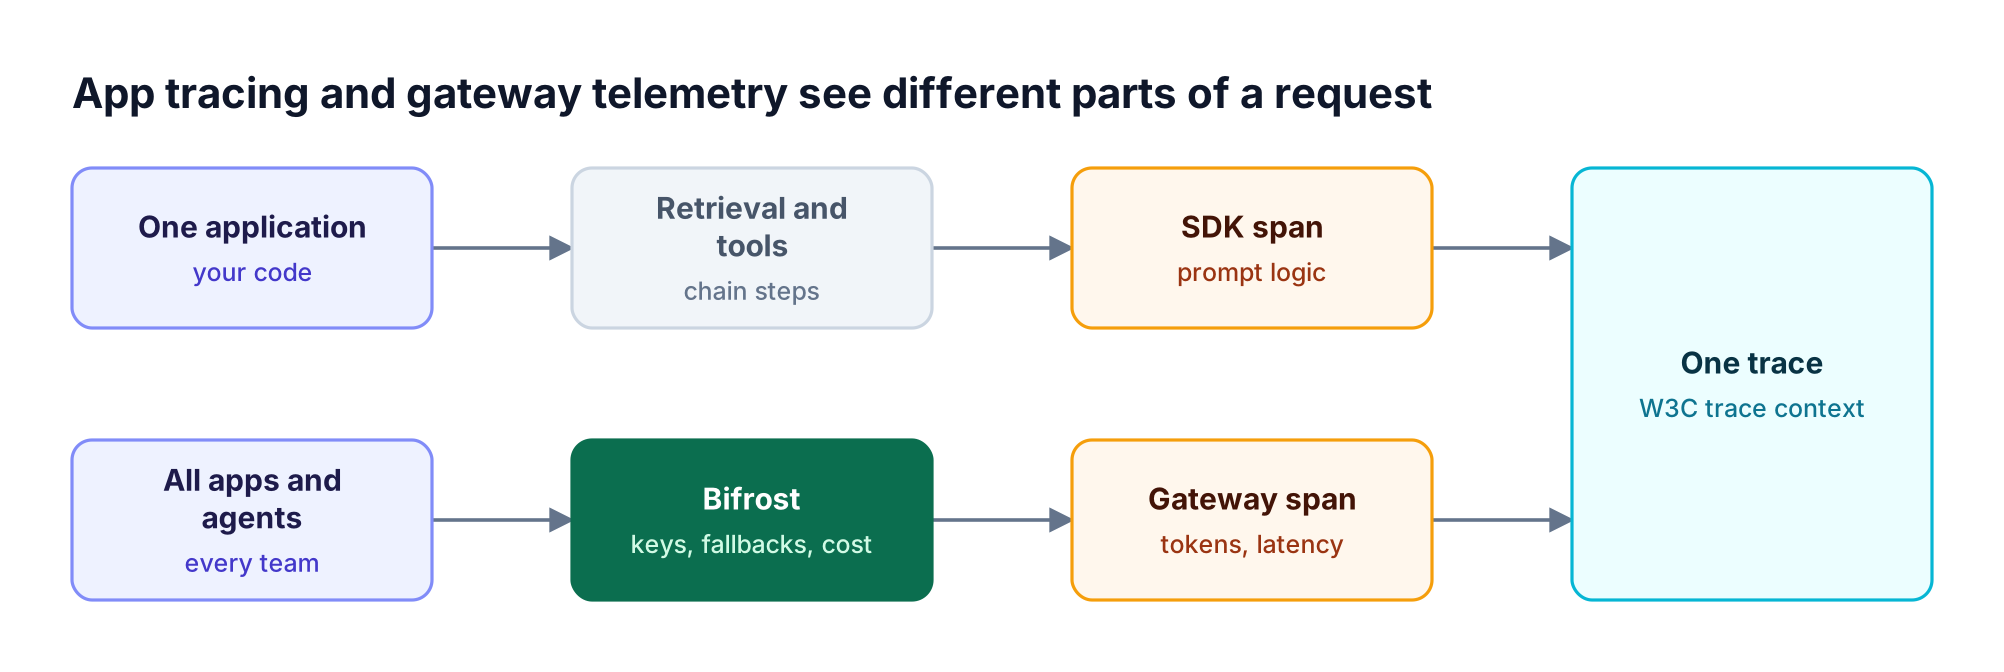
Figure 3: Application spans explain why a call was made; gateway spans prove what it cost and where it went.
Three practical differences decide where each signal should come from:
- Coverage. An SDK records only the applications that install it; Bifrost records every routed request, including uninstrumented coding agents.
- Ownership. Gateway metrics carry the virtual key and calling app, so cost lands on a team.
- Linking. With the Datadog plugin, Bifrost honors an inbound W3C
traceparentheader and links its spans as children of the application's trace, so both lanes appear in one view.
The OpenTelemetry project's overview of instrumentation for generative AI explains why shared conventions matter for that join. Our walkthrough of OpenTelemetry traces and metrics for LLM workloads and the guide to LLM logging and OTel tracing in Bifrost cover the configuration.
AI Agent Observability: Models, Tools, and Agents in One View
AI agent observability means following one task across the model calls, tool calls, and agent-to-agent operations it produced. Agents fail between steps as often as inside them, so a tool that sees only completions misses most of the failure surface.
Bifrost governs model, MCP tool, and agent traffic as one gateway, and its logs reflect that. MCP tool calls are logged alongside model calls, and the MCP gateway applies the same access rules to tools; our article on auditing every AI tool call covers that side.
For agent-to-agent traffic, Agent Logs group A2A operations by session and show the correlated LLM and MCP logs when agents send the correlation headers.
The Agent Gateway launch post explains the model, and our roundup of agent observability platforms covers application-side options.
How to Choose an LLM Observability Tool
Choose an LLM observability tool by starting from the backend your team already operates, then feeding it gateway telemetry so every model call is covered. A separate silo for AI data is rarely checked during incidents, and the AI observability explainer covers why.
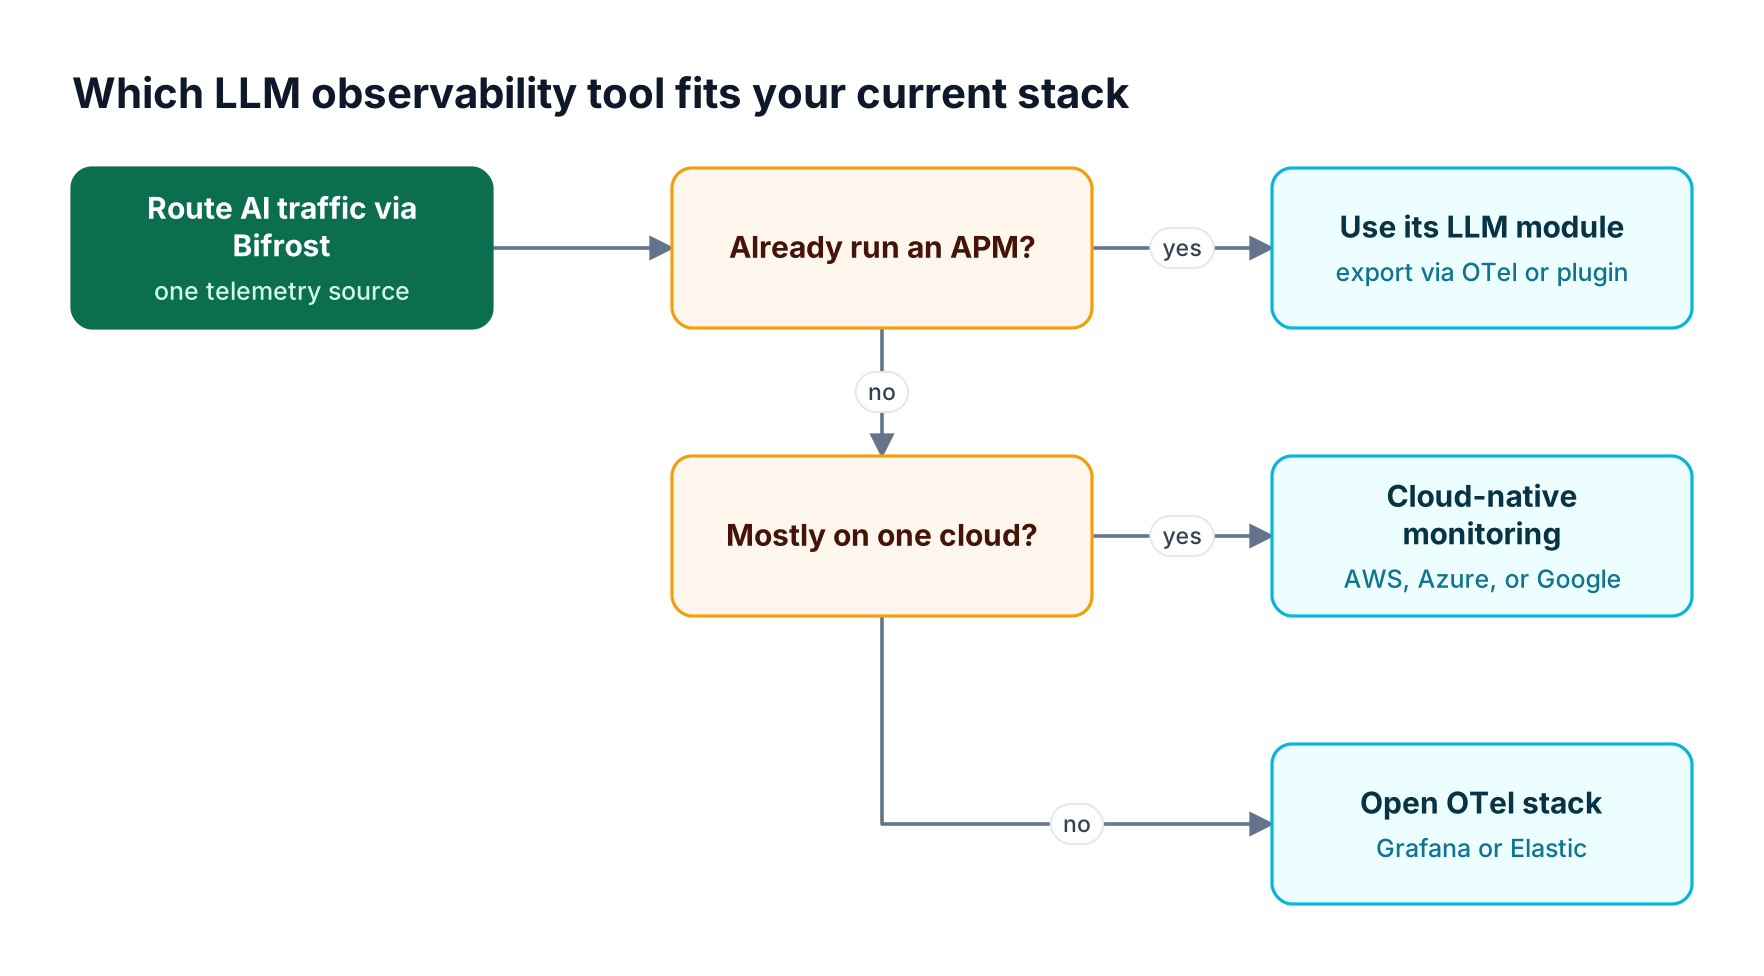
Figure 4: Pick the backend your team already operates, and feed it gateway telemetry rather than adding another silo.
As Figure 4 shows, the decision is mostly about where data should land:
- Already on an APM platform: keep it. Turn on its LLM module for application spans and send gateway spans to it through OTLP or a native plugin.
- Mostly on one cloud: CloudWatch, Azure Monitor, or Google Cloud Observability covers that cloud's managed models; Bifrost adds the calls that go to other providers.
- Neither: an open OpenTelemetry stack on Grafana or Elastic, fed by Bifrost's Prometheus and OTLP exports, keeps costs predictable and avoids lock-in.
Our enterprise AI observability guide expands this into a rollout plan, and the AI governance and observability overview shows how both run from the same gateway.
Frequently Asked Questions
What are LLM observability tools?
LLM observability tools collect and analyze telemetry from large language model calls, including prompts, responses, token usage, cost, latency, and errors. They capture data either inside applications through SDKs or at an AI gateway that sees every request. Most export to standard backends through OpenTelemetry so AI data sits next to service and infrastructure telemetry.
What is the difference between LLM observability and LLM monitoring?
LLM monitoring tracks known metrics such as latency, error rate, token usage, and cost, and alerts on thresholds. LLM observability adds full request context (prompts, responses, tool calls, keys, retries) so engineers can investigate failures they did not anticipate. One telemetry pipeline usually serves both.
Do you need an AI gateway for LLM observability?
An AI gateway is not required, but it is the only layer that sees every model call regardless of which application or team made it. Without one, coverage depends on every team maintaining an SDK. Bifrost records each request at the gateway and exports it to existing backends.
How does OpenTelemetry support LLM observability?
OpenTelemetry provides the OTLP export protocol and GenAI semantic conventions, which define standard attribute names for model, token, and operation data in generative AI client spans. Bifrost exports traces in this format over HTTP or gRPC to any OTLP collector.
How do you track LLM cost and token usage across teams?
Track LLM cost by attributing every request to an owner at the point it enters the AI stack. Bifrost labels token and cost metrics with the virtual key, provider, model, and calling app, so spend can be grouped by team, project, or customer. Budgets on the same keys then turn that visibility into enforcement, as our guide to monitoring LLM API costs shows.
What is AI agent observability?
AI agent observability follows a single task across the model calls, tool calls, and agent-to-agent operations it triggers. It needs session or correlation IDs that tie those records together. Bifrost groups agent operations by A2A context ID and shows the matching LLM and MCP logs, so one view covers what the agent asked, which tools it used, and what it cost.
Start Monitoring LLM Traffic with Bifrost
The strongest setup among these LLM observability tools is gateway telemetry from Bifrost feeding the backend your team already runs, with application tracing added where business logic needs it. Bifrost deploys in your own infrastructure and records every model, tool, and agent call. To see it with your own traffic, book a demo with the Bifrost team, or start from the Bifrost documentation.